


Clouds Gather Over Oil Market as Surplus Looms; Most Futures Main Contracts Fall, Plastic Spot Market May Continue Narrow Adjustment
1. Overnight Crude Oil Market Dynamics
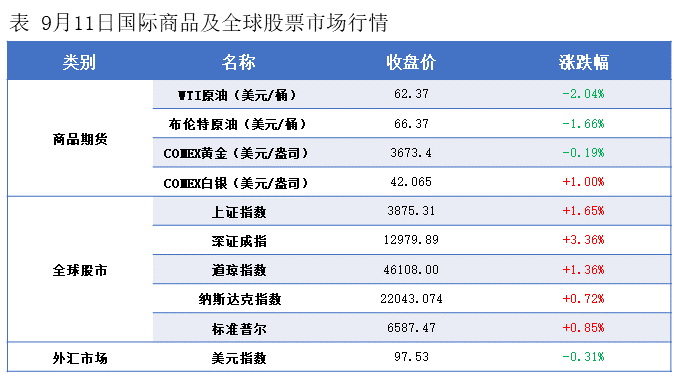
Market concerns about long-term supply surplus risks, coupled with weakening demand in the United States, have led to a decline in international oil prices.Crude oil futuresThe 10-year contract fell by $1.30/barrel to $62.37, a decrease of 2.04% month-on-month; ICE Brent crude futures for the 11-month contract fell by $1.12/barrel to $66.37, a decrease of 1.66%. China's INE crude oil futures for the 2510 contract rose by 3.7 to 489.4 yuan/barrel, but fell by 7.1 to 481.6 yuan/barrel in the night session.
Future Market Forecast
Oil prices plummeted 2% on Thursday, completely erasing the gains from the previous trading day. Data continuously released by multiple authoritative institutions indicate that the oversupply pressure is becoming a reality, overshadowing the geopolitical disturbances that have occurred since the beginning of the week.
According to the OPEC monthly report, the average crude oil production of OPEC+ in August was 42.4 million barrels per day, an increase of 509,000 barrels per day compared to July. The oil-producing countries are achieving their maximum production increase. Since the start of production increase in April, OPEC+ has cumulatively increased production by 1.48 million barrels per day, according to OPEC statistics. The International Energy Agency stated that the largest increases came from Saudi Arabia and other core Middle Eastern oil-producing countries. However, tanker tracking data indicates that most of the additional production has been absorbed by regional refining activities and power generation rather than being exported to other regions. The growth of oil supply from non-OPEC+ countries continues rapidly, with oil production in the United States, Brazil, Canada, Guyana, and Argentina at or near historic highs. Non-OPEC+ producers now plan to increase production by 1.4 million barrels per day in 2025 and slightly more than 1 million barrels per day next year. It is expected that OPEC+ will increase production by 1.3 million barrels per day in 2025 and 1 million barrels per day next year, comparable to non-OPEC+.
In September, OPEC+ still has a plan for a production increase acceleration of 548,000 barrels per day, while oil demand is expected to peak and then decline. As we enter the first week of September, EIA's weekly data shows that U.S. crude oil and petroleum product inventories have significantly accumulated by nearly 16 million barrels, marking the largest increase since 2023, higher than the levels of the same period last year, and the inventory build-up has evidently accelerated. Reports from the three major authoritative agencies have all been released, indicating that as OPEC+ continues to increase production, the pressure of surplus is further escalating. The comprehensive inventory build-up in the oil market will become the main focus in the upcoming period, and data from early September suggests that this concern is becoming a reality.
At the macro level, according to data from the U.S. Department of Labor, initial jobless claims for the week ending September 6 reached 263,000, the highest level since October 2021. The U.S. inflation rate for August rose to 2.9%, with mixed signals from the detailed data. The impact of tariffs has not yet fully materialized, highlighting the challenges faced by the Federal Reserve ahead of its significant interest rate decision next week. Traders have fully priced in three rate cuts by the Federal Reserve by the end of 2025. According to CME's "FedWatch," the probability of a 25-basis-point rate cut in September is 89.1%, while the probability of a 50-basis-point cut is 10.9%.
2. Macroeconomic Trends
1、The US August unadjusted CPI year-on-year recorded 2.9%, the highest since January.In August, the seasonally adjusted CPI in the United States recorded a monthly increase of 0.4%, the highest since January.
2、Initial jobless claims in the United States for the week ending September 6 surged to 263,000, reaching a nearly four-year high.Traders fully price in three rate cuts by the Federal Reserve by the end of 2025.
Foreign media: Baidu and Alibaba are using self-developed chips to train artificial intelligence models.
In the OPEC monthly report: OPEC+ crude oil production in August averaged 42.4 million barrels per day, an increase of 509,000 barrels per day compared to the previous month.
5. American media:Besent plans to add one or two more candidates to the list of candidates for the Federal Reserve Chairman, having previously finalized three candidates.
6、U.S. Commerce Secretary Raimondo: If India stops buying Russian oil, the U.S. and India will reach a trade agreement.
7、The European Central Bank kept its three key interest rates unchanged, in line with expectations.Sources say European Central Bank officials see December as the next opportunity for a rate cut.
8、The State Council has approved the launch of comprehensive reform pilots for the market-based allocation of 10 factors.
The National Health Commission: This year, the country will launch an HPV vaccination service for girls of appropriate age.
The Ministry of Commerce: We are closely monitoring Mexico's tax increase moves, and China will take necessary measures based on the actual situation.
11. The People's Bank of China and Bank Indonesia jointly launched the bilateral local currency settlement framework and QR code interoperability cooperation project.
The Ministry of Commerce held a roundtable meeting with foreign trade enterprises: Efforts will be made to address the difficulties and problems faced by foreign trade enterprises and to stabilize the fundamentals of foreign trade.
3. Plastic Market Morning Update
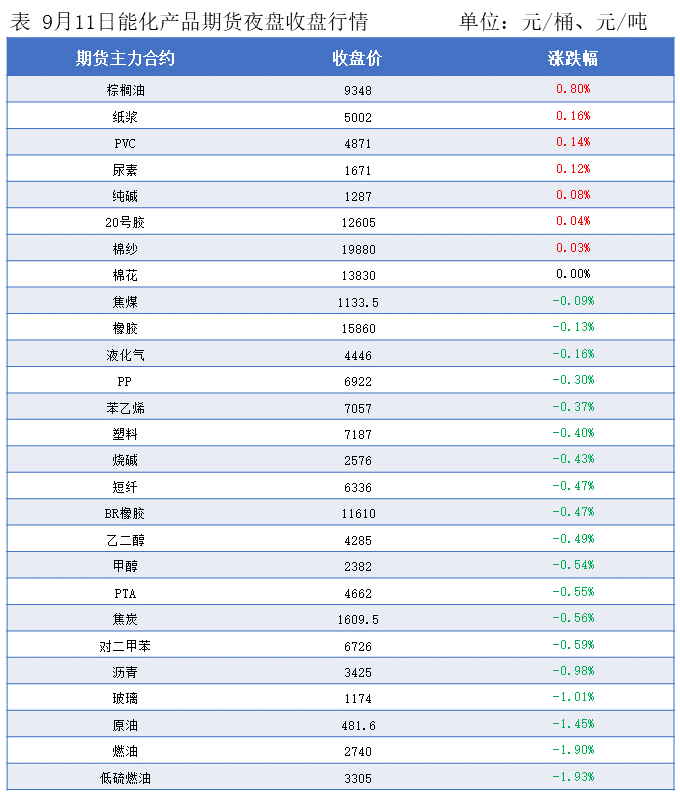
International oil prices have fallen! Overnight, the main domestic plastic futures contracts mostly declined with few increases.
The plastic 2601 contract is quoted at 7187 yuan/ton, down 0.40% from the previous trading day.
The PP2601 contract is quoted at 6,922 yuan/ton, down 0.30% from the previous trading day.
The PVC2601 contract is priced at 4871 yuan/ton, an increase of 0.14% compared to the previous trading day.
The styrene 2510 contract is quoted at 7,057 yuan/ton, down 0.37% from the previous trading day.
4. Market Forecast
In the short term, there are no clear signs of improvement on either the supply or demand side of the polyethylene market. The supply side remains stable without any impact from increased output, nor any favorable reduction, while the demand side continues to be dominated by rigid demand patterns that are difficult to break. The strategy of traders to exchange price for volume provides limited support to the market. It is expected that in the short term, the polyethylene market will continue to see narrow fluctuations and consolidation, with a lack of upward momentum in prices. If downstream demand continues to show no improvement, there is a possibility of localized prices being slightly pressured. It is crucial to focus on the fulfillment of demand during the upcoming peak season in September, known as the "Gold September," and the trend in inventory changes.
PP: In the short term, the polypropylene market is constrained by ample supply and limited improvement in demand, and it is expected to continue a trend of oscillation and consolidation. If the demand during the September peak season can be released as scheduled, and if key factors such as OPEC+ production increase pace and the progress of U.S. sanctions against oil-producing countries remain stable, the market is expected to gradually stabilize and achieve mild upward movement. However, if the demand does not meet expectations, the market is likely to maintain a weak performance.
PVC: On the supply and demand front, prices continue to be pressured, particularly due to the ongoing ease of supply, while there has not been a turning point on the demand side. Currently, neither policies nor news have shown significant influence. Overall, in the short term, the PVC spot market is expected to continue with narrow adjustments in the absence of a clear turning point.
【Copyright and Disclaimer】This article is the property of PlastMatch. For business cooperation, media interviews, article reprints, or suggestions, please call the PlastMatch customer service hotline at +86-18030158354 or via email at service@zhuansushijie.com. The information and data provided by PlastMatch are for reference only and do not constitute direct advice for client decision-making. Any decisions made by clients based on such information and data, and all resulting direct or indirect losses and legal consequences, shall be borne by the clients themselves and are unrelated to PlastMatch. Unauthorized reprinting is strictly prohibited.
Most Popular
-

AI Computing Power Demand Ignites Electronic Fabrics! China Jushi Hits Limit Up! Domestic Substitution Welcomes Golden Window
-

Focus on going global! kingfa sci. leads, huitong, preter, and kumho nire follow, china’s modified plastics frenziedly expanding worldwide
-

Back-to-back major joker moves! covestro’s 1.32 million ton mdi dual-line expansion and hdi acquisition reshape global polyurethane landscape
-

Evonik Parts Ways With The Polyester Business! A Strategic Retreat By A Germany Chemical Giant And The Global Industry Shift
-

PA66 Cost and Profit: Broad-Based Weakness in the Feedstock Market Continues to Erode Cost Support for PA66 (202606)


