


China Toy Exports in the First Half of the Year Amid Tariff Shock
In the first half of this year, China’s toy exports faced pressure. According to the latest data released by the General Administration of Customs, from January to June, China’s toy exports (covering seven categories under customs tariff code 9503) reached USD 17.588 billion (all figures in this article are in USD unless otherwise noted), down 2.1% year-on-year. Factors contributing to the decline include additional tariffs imposed by the United States, the ongoing recovery of the global economy, and weak end-user consumption. In addition, the performance of certain emerging markets—once highly anticipated by the industry—also fell short of expectations in the first half of the year.

Multiple categories recorded a decline over several months.
Despite the high attention Chinese trendy toy brands have received overseas since the beginning of this year, toy exports have still recorded a decline, showing an overall sluggish trend.
In terms of single-month exports, China's toy exports only achieved year-on-year growth in export value in March and June, with June's export value reaching $3.643 billion, the highest monthly export value in the first half of the year. The toy export value declined in the other four months, with the largest drop appearing in February, a decrease of 26.4%.
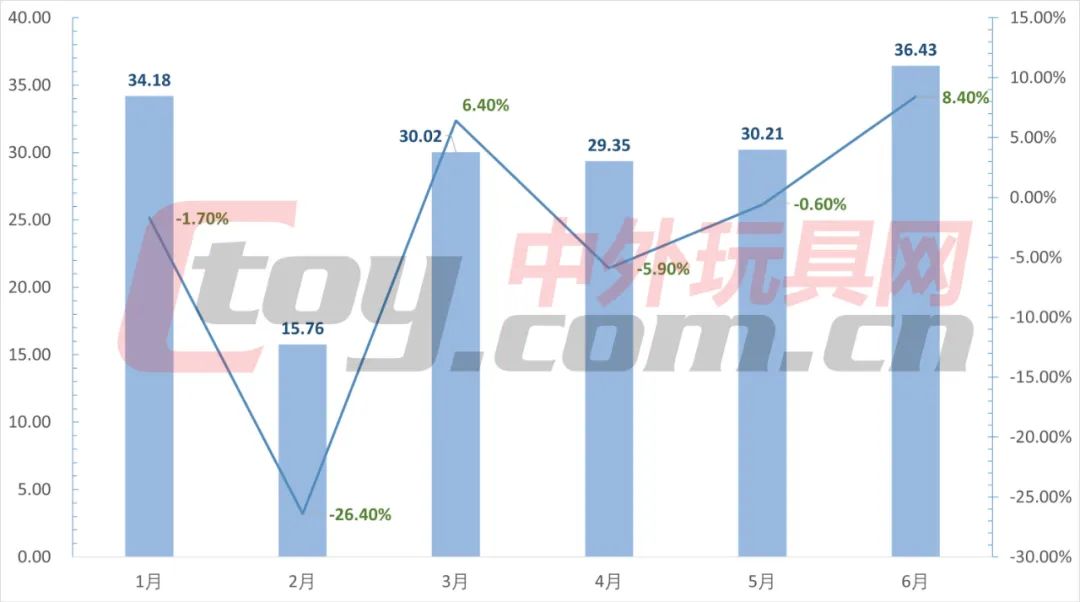
China's Toy Export Value and Year-on-Year Change from January to June 2025 (Unit: 100 million USD)
According to the seven major categories classified by the Customs Tariff Code, four categories achieved an increase in export value in the first half of this year. The highest growth was in "toys and animals," with a year-on-year increase of 11.76%; "other toys and models with driving power," "dolls, whether dressed or not," and "parts and accessories of goods listed under item 9503" rose by 5.37%, 4.82%, and 0.81% respectively.
There are three categories that recorded a decline in export value, with the largest drop seen in "wheeled toys for children to ride on (such as tricycles, scooters, pedal cars); doll carriages," which fell by 8.93%. "Other toys and models not elsewhere specified" and "educational toys" decreased by 6.04% and 2.41%, respectively. Notably, "other toys and models not elsewhere specified" achieved an export value of USD 9.028 billion in the first six months, accounting for 51.33% of total exports, making it the category with both the highest value and the largest share. The decline in this category has had a significant impact on the overall trend of toy export values.
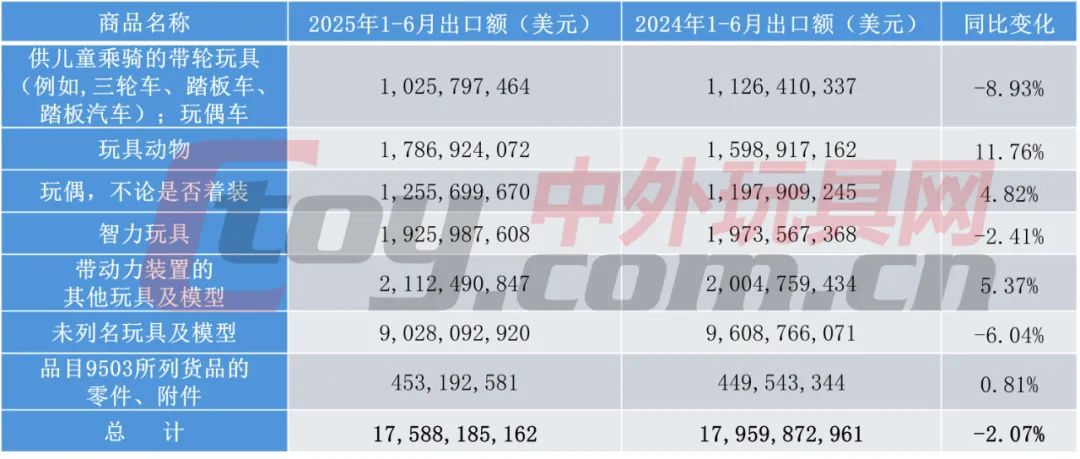
Export Value and Year-on-Year Change of 7 Major Categories in the First Half of 2025
Tariff Increases Affect Toy Exports
The United States is the largest destination for China's toy exports, and the tariff dispute in the first half of the year directly led to a significant decline in toy exports to the U.S. This is also one of the main reasons for the overall decrease in China's toy export value in the first six months.
According to customs data, from 2020 to 2024, the proportion of China’s toy exports to the United States accounted for more than 24% of the country’s total toy exports each year, with the highest proportion approaching 30%. However, in the first half of this year, due to the frequent imposition of additional tariffs by the United States on goods originating from China, China’s toy exports to the United States reached 3.696 billion US dollars, a year-on-year decrease of 8.36%. This accounted for 21.01% of total toy exports in the first six months, a decline compared with previous years.
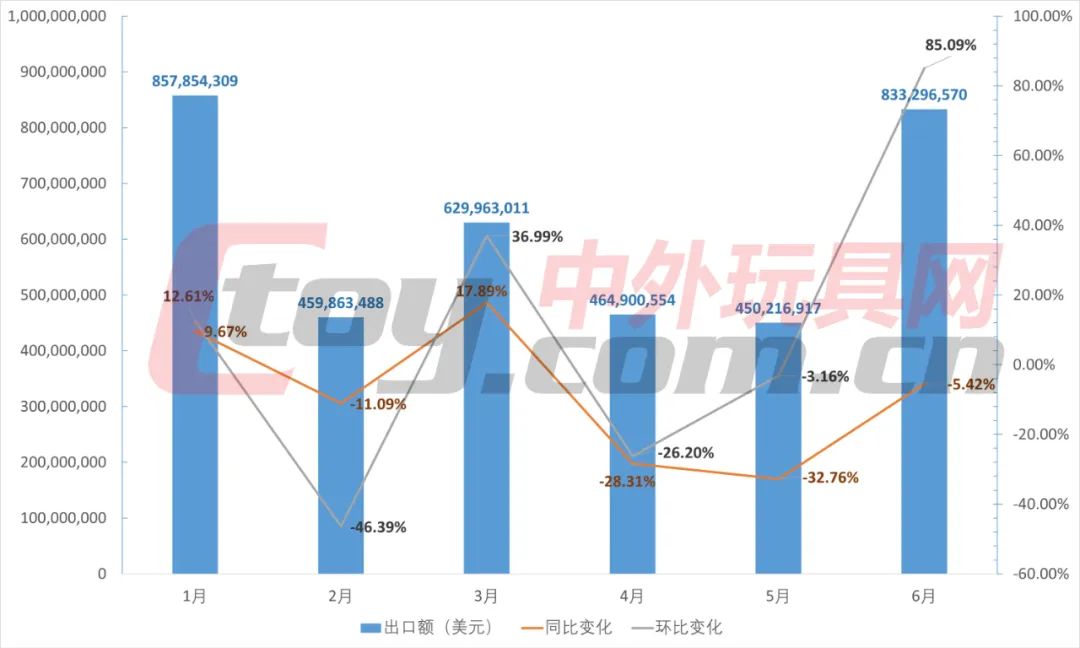
In terms of monthly exports, China's toy exports to the United States in January and March saw year-on-year growth rates of 9.67% and 17.89%, respectively. However, there were year-on-year declines in the remaining four months, with the largest drop occurring in May (-32.76%). As the additional tariff rate was temporarily set at 10% during China-U.S. negotiations in mid-May, China’s toy exports to the U.S. gradually recovered. Specifically, in June, the export value reached $833 million, a year-on-year decrease of 5.42%, but an 85.09% increase compared to May this year.
In recent years, China's toy exports to Mexico have grown significantly, partly because some Chinese-made toys are first shipped to Mexico and then re-exported to the United States. However, as the US has increased tariffs on many countries and tightened inspections of country-of-origin information, this strategy is no longer viable, which has in turn affected China's toy exports to Mexico. In the first half of this year, China's toy exports to Mexico fell by 23.11% year-on-year to $501 million; in terms of exports to a single country, Mexico dropped from 4th place in the same period last year to 9th place this period.
The European market is showing a steady upward trend.
In addition to the United States, Europe is also a key market for Chinese toy companies and a traditional market for China's toy exports. Compared with the fluctuations in the U.S. market, China's toy exports to Europe are relatively stable.
The European Union is the largest regional integration organization in Europe and the second-largest trading partner for China's toy exports. According to customs data, in the first half of this year, China's toy exports to the EU reached 3.001 billion US dollars, an increase of 5.86% year-on-year, accounting for 17.06% of total toy exports. Although the EU has 27 member states, the main toy markets worth noting are in eight countries: Germany, the Netherlands, France, Poland, Italy, Spain, Belgium, and Greece. In the first half of the year, these countries imported a total of 2.586 billion US dollars worth of toys from China, accounting for 86.17% of the EU’s total.
Specifically, the toy export value to Germany reached 644 million USD, an increase of 18.29% year-on-year, ranking first within the EU in both export value and growth rate. The Netherlands and France ranked second and third, with export values of 562 million USD and 310 million USD, respectively, representing year-on-year growth of 17.87% and 11.08%. Spain, Belgium, and Greece also achieved varying degrees of growth. However, Poland and Italy recorded declines, with export values of 304 million USD and 230 million USD, down 7.31% and 12.64% year-on-year, respectively.
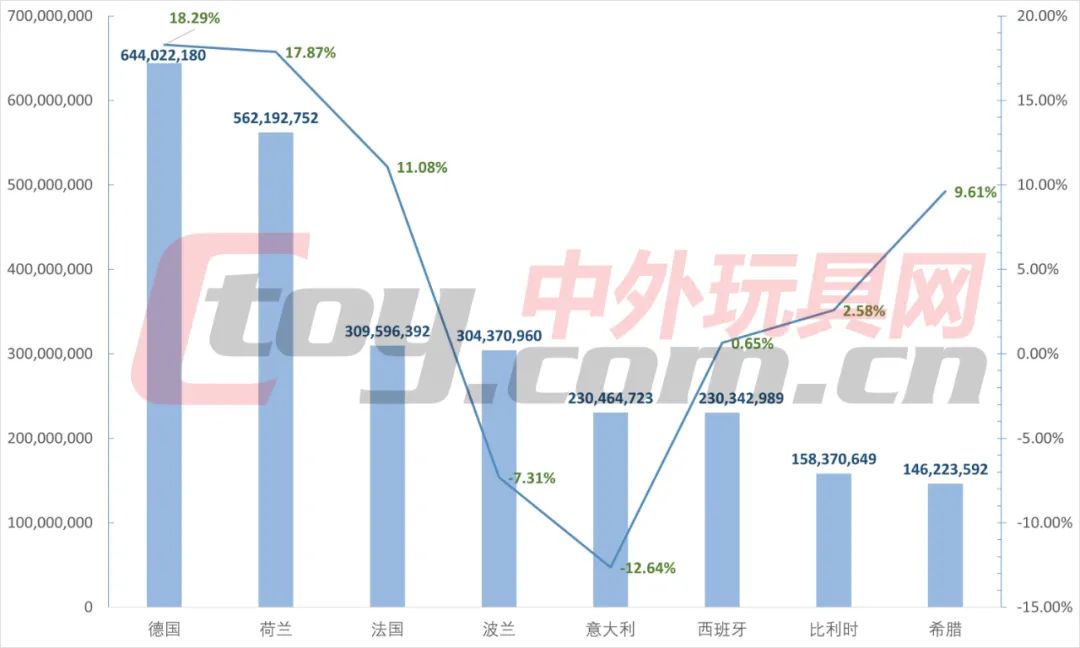
2025 First Half Toy Export Value to 8 EU Countries and Year-on-Year Change
Outside the EU, the UK is also an important trading partner for China's toys: From January to June this year, China's toy exports to the UK amounted to $718 million, a year-on-year increase of 4.45%. Among the 7 major categories, "other toys and models with a power source" and "parts and accessories of goods listed under heading 9503" recorded declines of 5.6% and 9.78% respectively, while the other 5 categories all achieved year-on-year growth.
Southeast Asia's performance did not meet expectations.
Southeast Asia is a region with relatively active and fast-growing economies globally, and it has become one of the emerging markets that Chinese toy companies have been expanding into in recent years. Although the region comprises 11 countries, their economic development is highly uneven, and there are significant differences in land area and population. According to customs data rankings, China's toy exports to this region are mainly concentrated in six major economies: Singapore, Malaysia, Thailand, Vietnam, Indonesia, and the Philippines. In contrast, exports to Cambodia, Myanmar, Laos, Brunei, and East Timor are relatively low.
Whether traditional toy companies or trendy toy enterprises, all attach great importance to the Southeast Asian market. However, judging from the toy export data for the first half of this year, the performance in this region fell short of expectations: from January to June, China’s toy exports to 11 Southeast Asian countries reached USD 2.711 billion, a slight year-on-year decrease of 0.82%, accounting for 15.41% of total toy exports in the first half of the year. Among them, only four countries saw year-on-year growth: Laos (104.47%), Singapore (15.27%), Malaysia (10.09%), and Indonesia (6.78%); seven countries recorded a year-on-year decline, with Myanmar, Brunei, and Cambodia experiencing a decrease of more than 30%.
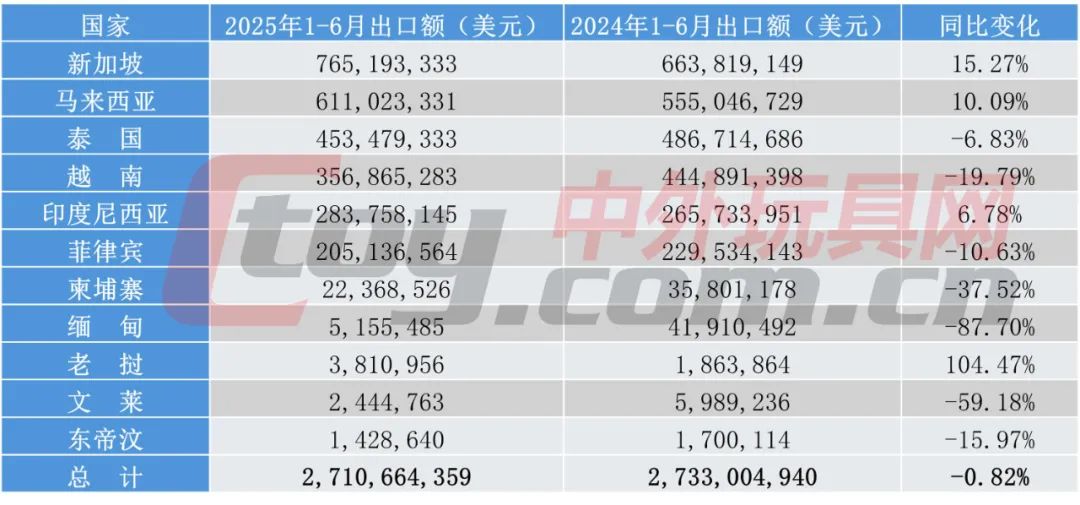
Toy Exports to 11 Southeast Asian Countries in the First Half of 2025 and Year-on-Year Changes
In May this year, reporters from China Toy & Juvenile Products Association visited the political and economic centers of five countries: Vietnam, Thailand, Malaysia, Singapore, and Indonesia. Overall, except for Jakarta in Indonesia, where the children's industry is relatively prosperous and the children's toy market is more vibrant, the traditional children's toy markets in the other countries remain relatively subdued. Driven by Chinese trendy toy brands such as Pop Mart, trendy toys have become more popular in these countries, and many traditional toy sales channels are also transforming towards trendy toys.
South America rises, Middle East falls.
At this year's spring Canton Fair, many exhibitors noted that they received a relatively large number of clients from South America and the Middle East, and they also showed interest in these markets. Despite both being emerging markets, the toy export performance in these two regions showed significant differences in the first half of the year.
In South America, customs data shows that in the first half of this year, China had toy export trade with 14 countries and regions. Among them, the export value to South Georgia and the South Sandwich Islands was the lowest, at only 10,600 USD; the export value to French Guiana was also only 28,600 USD, but the export growth rates to these two regions exceeded 100%. Among the other seven countries and regions with export values of less than 100 million USD, Paraguay (-7.2%) and Guyana (-10.99%) recorded year-on-year declines.
Noteworthy markets in South America include Brazil, Chile, Peru, Argentina, and Colombia. In the first six months of this year, China’s toy exports to these five countries amounted to USD 417 million, USD 178 million, USD 127 million, USD 124 million, and USD 116 million, respectively. Except for Peru, which recorded a year-on-year decline of 13.07%, the other four countries all saw growth, with the largest increase seen in Argentina (114.85%).
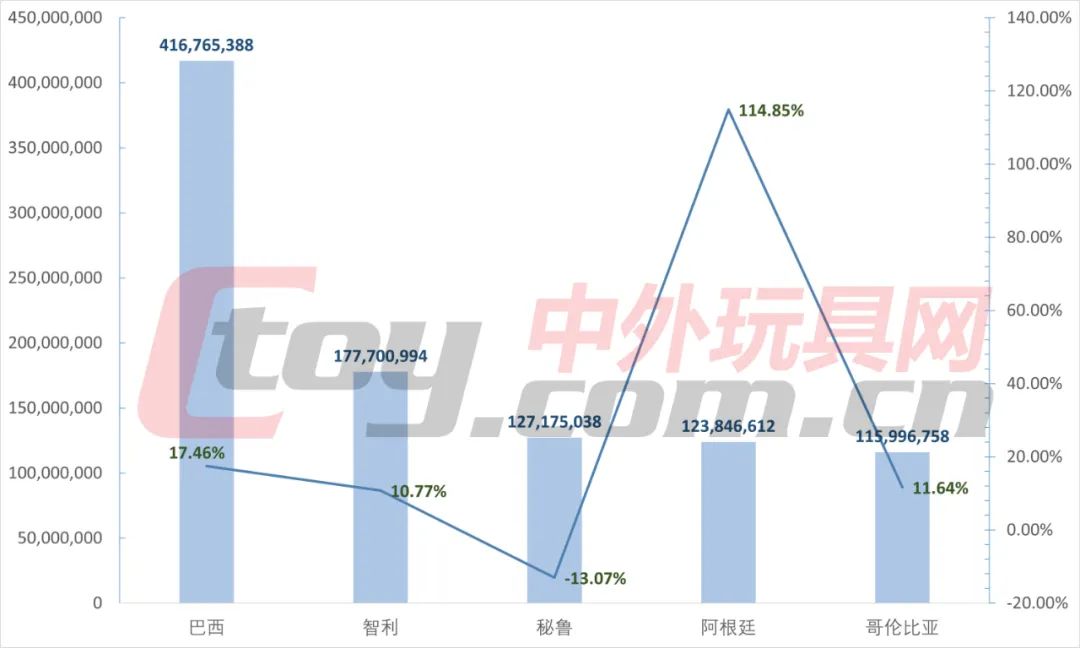
Toy Export Value and Year-on-Year Change to Five South American Countries in the First Half of 2025
Furthermore, there is the Middle East. China's toy export volume to this region is not very large, mainly concentrated in five major markets: Saudi Arabia, the United Arab Emirates, Turkey, Iraq, and Israel. In the first six months of this year, except for a 24.15% increase in toy exports to Turkey, toy exports to the other four countries all experienced a decline of over 10%.
Among other Middle Eastern countries and regions, those with faster growth in the first half of the year include Egypt (20.72%), Lebanon (13.44%), Cyprus (32.16%), and Jordan (36.05%); those with significant declines include Iran (-30.63%), Tunisia (-24.56%), Morocco (-19.59%), Bahrain (-21.67%), Palestine (-21.48%), Oman (-28.75%), and Algeria (-34.76%).
Overall, in the first half of this year, China's toy exports to Middle Eastern countries and regions saw fewer increases and more declines. The main reason for this situation is likely the tense situation and complex geopolitics in the Middle East, such as the Iran-Israel conflict.
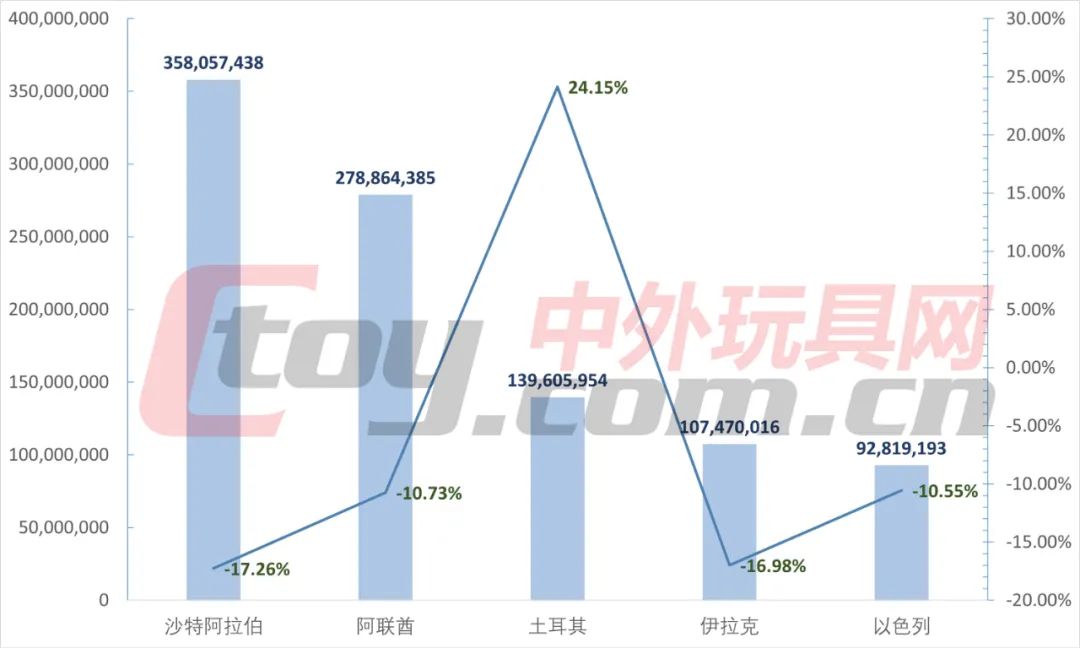
Toy Export Value to 5 Middle Eastern Countries and Year-on-Year Change in the First Half of 2025
In addition to the aforementioned countries and regions, the export situation in some traditional and emerging markets is also worthy of industry attention. In terms of traditional markets, Japan and South Korea are countries with close toy trade relations with China. In the first half of the year, toy imports from China showed both increases and decreases: In the first six months, China's toy exports to Japan amounted to 985 million USD, up 0.59% year-on-year; toy exports to South Korea amounted to 615 million USD, down 4.43% year-on-year. Furthermore, Canada imported 306 million USD worth of toys from China in the first half of the year, a year-on-year increase of 30.66%, which is the largest growth among all traditional markets; toy imports from China to Australia decreased by 13.4% year-on-year to 390 million USD.
Among emerging markets, Russia is the most noteworthy. In the first half of this year, several traditional toy and trendy toy companies mentioned that, due to Western sanctions against Russia, some international toy giants have gradually withdrawn from the Russian market. This has provided Chinese companies with an opportunity to "pick up the slack," allowing them to make significant progress in expanding into the Russian market. However, customs data is not optimistic: China's toy exports to Russia amounted to $368 million, down 7.48% year-on-year.
【Copyright and Disclaimer】The above information is collected and organized by PlastMatch. The copyright belongs to the original author. This article is reprinted for the purpose of providing more information, and it does not imply that PlastMatch endorses the views expressed in the article or guarantees its accuracy. If there are any errors in the source attribution or if your legitimate rights have been infringed, please contact us, and we will promptly correct or remove the content. If other media, websites, or individuals use the aforementioned content, they must clearly indicate the original source and origin of the work and assume legal responsibility on their own.
Most Popular
-

AI Computing Power Demand Ignites Electronic Fabrics! China Jushi Hits Limit Up! Domestic Substitution Welcomes Golden Window
-

Focus on going global! kingfa sci. leads, huitong, preter, and kumho nire follow, china’s modified plastics frenziedly expanding worldwide
-

PA66 Cost and Profit: Broad-Based Weakness in the Feedstock Market Continues to Erode Cost Support for PA66 (202606)
-

Back-to-back major joker moves! covestro’s 1.32 million ton mdi dual-line expansion and hdi acquisition reshape global polyurethane landscape
-

Evonik Parts Ways With The Polyester Business! A Strategic Retreat By A Germany Chemical Giant And The Global Industry Shift


