


Butadiene Supply and Demand Imbalance Puts Pressure on ABS Raw Material Costs
Butadiene, as a key intermediate in the petrochemical industry, directly influences the production patterns of important downstream sectors such as synthetic rubber and resins. ABS, being one of the largest consumption areas for butadiene, sees its capacity expansion and raw material matching conditions closely watched. This article analyzes from the perspectives of the current status of butadiene facilities, regional supply-demand balance, and the marginal capacity of the ABS industry.
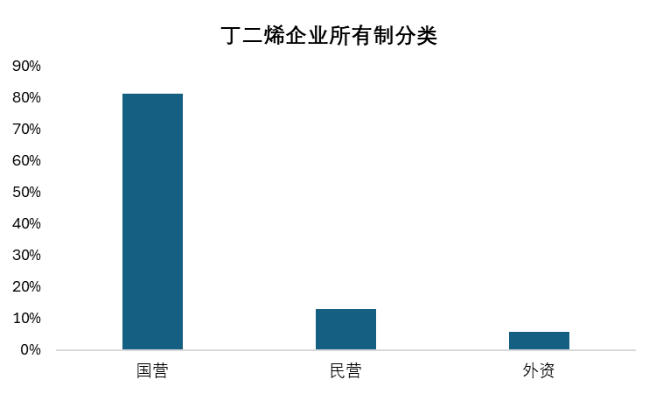
1. Butadiene Production Capacity Structure: Integration-led and State-owned Concentration
In China, the production capacity of butadiene has reached 7.137 million tons, primarily using the C4 extraction method (accounting for 93.15%). The oxidative dehydrogenation process has been largely phased out due to high costs. From the perspective of enterprise structure, state-owned enterprises (mainly PetroChina and Sinopec) account for as much as 81.22% of the production capacity, while private enterprises account for only 13.03%. This structure determines that the market has strong policy and conglomerate regulation characteristics.
In terms of regional distribution, production capacity is highly concentrated in the East China region, accounting for 52.45% of the total capacity, while South China and Northeast China account for 15.34% and 13%, respectively. East China is not only the main production area but also the core downstream consumption area, forming a "both production and sales" closed-loop characteristic.
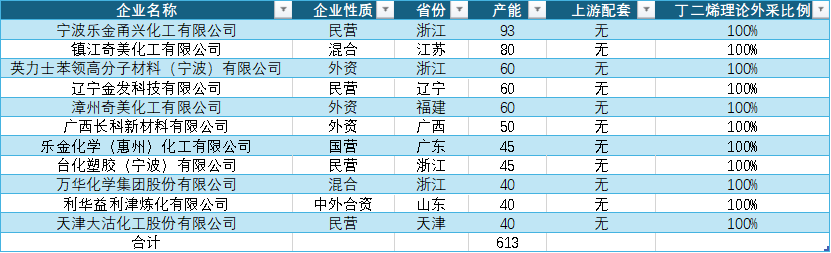
Currently, the model of butadiene units primarily relying on external raw material procurement is very rare in our country, with only a few early units having some external procurement needs, reflecting the industry's major trend towards "refining and chemical integration."
2. Expansion of ABS Production Capacity and Raw Material Bottleneck
ABS, as the synthetic resin with the highest downstream demand for butadiene, has a domestic production capacity of 10.49 million tons. From a process perspective, the emulsion grafting method dominates, accounting for 90.67%.
It is noteworthy that only 25.53% of ABS facilities are equipped with supporting butadiene raw materials, which means that nearly 75% of ABS facilities need to purchase butadiene externally. Raw material cost becomes a key variable affecting the profitability of enterprises.
Geographically, ABS production capacity is also concentrated in the East China region (accounting for 64%), followed by Northeast and South China. Among these regions, except for some facilities in the Northeast that have an integrated advantage, most ABS factories in East and South China rely on external butadiene supply, forming an industrial pattern of "external raw materials, internal processing."
3. Regional Supply and Demand Imbalance and Logistics Pattern
From the perspective of overall supply and demand for butadiene, domestic production capacity is basically self-sufficient, but there is a prominent mismatch between supply and demand across different regions. Although the production capacity in the East China region accounts for more than half of the national total, due to the large downstream consumption volume, there is still a shortage of over 600,000 tons of raw materials, which needs to be supplemented by imports and other regions.
In contrast, regions such as Northwest and North China are experiencing a state of oversupply. Particularly in the Northwest, there are almost no downstream supporting facilities, necessitating cross-regional transportation of the produced butadiene. This structural contradiction has led to a logistics pattern of "west-to-east and north-to-south" transportation of butadiene, while also providing opportunities for imported sources.
4. Sensitivity Analysis of Marginal Capacity
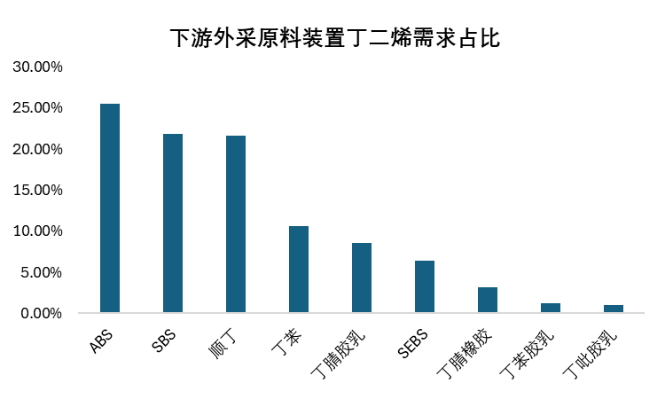
In the downstream of butadiene, ABS, butadiene rubber, SBS, and styrene-butadiene rubber are the four main consumption areas, accounting for a total of 86.45% of the total demand for butadiene. Among these industries, facilities that do not have raw material support are more vulnerable to fluctuations in butadiene prices.
For example, in the case of ABS, the production capacity of externally sourced butadiene reaches 6.825 million tons. Although private enterprises do not hold a large proportion of the total production capacity, they have a significant share among externally sourcing companies. These enterprises are extremely sensitive to the price of butadiene, and their operating rates fluctuate significantly with profits, becoming the main factor affecting the marginal changes in ABS supply.
Similarly, in the fields of polybutadiene rubber and SBS, facilities that procure butadiene externally are mainly concentrated in East China and South China, with a higher proportion being privately-owned. During periods of rising butadiene prices, these companies are often the first to reduce operating rates or shut down operations, forming a "price-operation rate" negative feedback mechanism.
V. Development Trends and Outlook
Butadiene and the ABS industry chain exhibit characteristics of "state-owned dominance, regional concentration, and insufficient support." The following trends are worth noting for the future:
- Device integration is further enhanced: new projects are increasingly equipped with downstream facilities, and outdated processes are gradually being phased out.
- The gap in ABS raw materials may widen: The reliance on imported butadiene in East China remains high, making cost control capabilities a key competitive factor for enterprises.
- Regional balance depends on logistics coordination: With the commissioning of new facilities, the supply-demand pattern between regions may face restructuring.
- The marginal capacity pricing mechanism is strengthened: units without supporting facilities will be the first to reduce production, thereby curbing further price increases.
Author: Zhao Hongyan, Specialist in Market Research at ZHUANSU VISION
【Copyright and Disclaimer】This article is the property of PlastMatch. For business cooperation, media interviews, article reprints, or suggestions, please call the PlastMatch customer service hotline at +86-18030158354 or via email at service@zhuansushijie.com. The information and data provided by PlastMatch are for reference only and do not constitute direct advice for client decision-making. Any decisions made by clients based on such information and data, and all resulting direct or indirect losses and legal consequences, shall be borne by the clients themselves and are unrelated to PlastMatch. Unauthorized reprinting is strictly prohibited.
Most Popular
-

AI Computing Power Demand Ignites Electronic Fabrics! China Jushi Hits Limit Up! Domestic Substitution Welcomes Golden Window
-

Focus on going global! kingfa sci. leads, huitong, preter, and kumho nire follow, china’s modified plastics frenziedly expanding worldwide
-

Back-to-back major joker moves! covestro’s 1.32 million ton mdi dual-line expansion and hdi acquisition reshape global polyurethane landscape
-

Evonik Parts Ways With The Polyester Business! A Strategic Retreat By A Germany Chemical Giant And The Global Industry Shift
-

PA66 Cost and Profit: Broad-Based Weakness in the Feedstock Market Continues to Erode Cost Support for PA66 (202606)


