


Behind pop mart's surging performance: The Plastics Industry Embraces a Revolution of High-End and Green Transformation
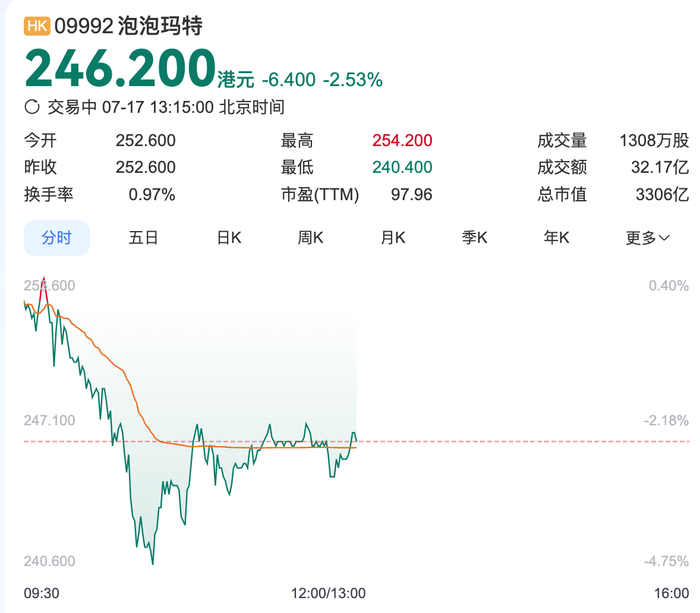
On July 17, Hong Kong stocks related to new consumption continued to decline. As of the time of reporting, Pop Mart (09992.HK) fell by over 2.5%, with a transaction volume exceeding 3.2 billion Hong Kong dollars, and the latest market value is 330.6 billion Hong Kong dollars.
According to Caixin, on the first trading day after Pop Mart released a positive profit forecast announcement (July 16), the number of shares sold short surged to 2.4956 million, more than six times the 342,000 shares on the previous trading day (July 15), reaching a new high since June 20.
Goldman Sachs pointed out in its latest research report that although Pop Mart's performance exceeded the general expectations of sell-side analysts, it may only "roughly meet" the high expectations that buy-side investors had previously raised to very high levels. JPMorgan noted that the net profit growth forecasted by Pop Mart actually falls at the lower end of the previous buy-side expectation range (approximately 4.5 billion to 5.5 billion yuan).
Looking back at the development trajectory of Pop Mart, from January 2, 2024, to now, its stock price has increased by over 1000%, with an increase of nearly 200% in 2025 alone. In the first quarter of this year, Pop Mart's performance has shown explosive growth. On April 22, it announced that its overall revenue for the first quarter of 2025 increased by 165%-170% year-on-year, with revenue in China increasing by 95%-100% and overseas revenue increasing by 475%-480%. In terms of revenue by region, the Asia-Pacific (referring to countries and regions in Asia and Oceania excluding China) increased by 345%-350% year-on-year, the Americas increased by 895%-900%, and Europe increased by 600%-605%. At the annual performance briefing held in April, Pop Mart's Chairman and CEO Wang Ning stated that the company's performance growth in 2024 exceeded expectations, mainly due to the successful implementation of its internationalization strategy, which has become the second growth curve for the company. Looking ahead to 2025, the management team is full of confidence, planning to achieve a year-on-year sales growth of over 50% based on the high base in 2024, with overseas sales expected to grow by over 100%. The goal is to reach an overall sales amount of 20 billion yuan, with overseas sales exceeding 10 billion yuan.
The expansion of plastic demand behind the tide of trendy toys.
The astonishing growth curve of Pop Mart has directly driven a massive demand for high-end plastic materials. The products rely on materials such as PVC and polypropylene.Safety, plasticity, environmental protectionWith stringent standards, the production of plastic products in China has reached 2024.77.076 million tonsThe export value has surpassed the 100 billion US dollar mark.The rise of high-value-added consumer products like Pop Mart is forcing the upstream materials to upgrade.
It is particularly noteworthy that Pop Mart's overseas revenue has experienced explosive growth, and its products must comply with strict standards such as the EU REACH regulations. This directly drives the demand for environmentally friendly plasticizers—medical-grade epoxy soybean oil and citrate plasticizers are growing rapidly in the market.8.5%The average annual growth rate of the expansion is expected to exceed the scale by 2030.12 billion yuan。
The growing pains of industrial transformation under high environmental pressure.
With the global "plastic restriction order" escalating, traditional plastic enterprises are facing a life-and-death test.
Policy-driven pressureChina's "Plastic Pollution Control Action Plan" clearly restricts highly toxic plasticizers, while the EU REACH regulation establishes high trade barriers.
Rising costsIn 2025, the industry average gross profit margin will drop from 18% to 15%, and the net profit margin will fall below 6%, putting significant pressure on small and medium-sized enterprises.
Technical BreakthroughLeading companies like Wanhua Chemical and Jinhai Technology are seizing the opportunity by developing bio-based materials. Jinhai Technology's net profit in the first half of 2025 is expected to grow by 45% to 71% against the trend.
The shortcomings of the plastic recycling system have highlighted the urgency of transformation. Currently, the recycling costs are high and the application rate of recycled materials is low, and the industry's circular economy is still in a state of "The road is long and difficult."the critical stage of the battle"。
The polarized industry differentiation of ice and fire.
The performance of plastic enterprises in 2025 shows dramatic differentiation.
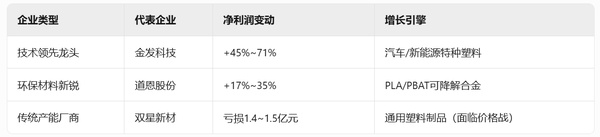
This differentiation confirms the structural transformation in the industry—high-end products can achieve a gross profit margin of over 30% (such as Wanhua Chemical), while general-purpose plastics are mired in a surplus of production capacity. The operating rate of the polypropylene industry has already fallen below70%However, specialty materials such as metallocene polypropylene and ultra-high transparency polypropylene are still in short supply.
Technological breakthroughs lead to the reshaping of industry chain value.
The path to a breakup has become clear.
Biobased alternativesLiancheng Chemical's bio-based plasticizer production capacity will double to 200,000 tons/year, and Wanhua Chemical is planning a citric acid ester production line.
Specialized breakthroughThe demand for anti-impact copolymer polypropylene driven by new energy vehicles will see the share of environmentally friendly plasticizers in the automotive sector reach 2030.35%
Digital cost reductionEnterprises that use AI to optimize production have reduced procurement costs.5%-8%Relieve the pressure of raw material price fluctuations.
The stringent requirements of Pop Mart and others for food-grade safety standards and low-carbon materials are being transmitted through the industrial chain, pushing plastic companies from "Price competition"Turn"Technical competition”。
Future Vision: The Double Helix of Green and High-End
When Pop Mart plans to achieve in 202520 billion in salesAt this time, behind it is a demand for high-end plastic materials worth hundreds of billions; as Wanhua Chemical accelerates the development of bio-based polyurethane at its R&D center, the upgrading bottlenecks in industries such as trendy toys, healthcare, and new energy are being broken one by one.
The future of the plastic industry depends on whether it can...Environmental compliance Technology premiumFind a balance in between. Just as the polypropylene industry has opened up high-end markets through metallocene materials, China's plastic processing industry is now at a point of...World Factory"toward"Source of Innovation"The critical point of the leap. This green revolution is not only related to the survival of enterprises but will also reshape the competitive landscape of global industrial chains."
【Copyright and Disclaimer】This article is the property of PlastMatch. For business cooperation, media interviews, article reprints, or suggestions, please call the PlastMatch customer service hotline at +86-18030158354 or via email at service@zhuansushijie.com. The information and data provided by PlastMatch are for reference only and do not constitute direct advice for client decision-making. Any decisions made by clients based on such information and data, and all resulting direct or indirect losses and legal consequences, shall be borne by the clients themselves and are unrelated to PlastMatch. Unauthorized reprinting is strictly prohibited.
Most Popular
-

AI Computing Power Demand Ignites Electronic Fabrics! China Jushi Hits Limit Up! Domestic Substitution Welcomes Golden Window
-

Focus on going global! kingfa sci. leads, huitong, preter, and kumho nire follow, china’s modified plastics frenziedly expanding worldwide
-

Back-to-back major joker moves! covestro’s 1.32 million ton mdi dual-line expansion and hdi acquisition reshape global polyurethane landscape
-

Evonik Parts Ways With The Polyester Business! A Strategic Retreat By A Germany Chemical Giant And The Global Industry Shift
-

PA66 Cost and Profit: Broad-Based Weakness in the Feedstock Market Continues to Erode Cost Support for PA66 (202606)


