


BASF Materials Business Becomes Responsible With 14.3 Billion Yuan!
On October 29, BASF Group released its financial report for the third quarter. The data indicates that under the dual pressures of weak demand and exchange rate fluctuations, the group's profit performance slightly exceeded market expectations. Additionally, it announced the early initiation of a €1.5 billion share buyback program.
In the third quarter, the overall operations of the group showed characteristics of "increased sales, stable revenue, and decreased cash flow." Due to business restructuring and external environmental influences, several core indicators have displayed structural changes.
Sales: Year-on-year decline due to exchange rates and prices.
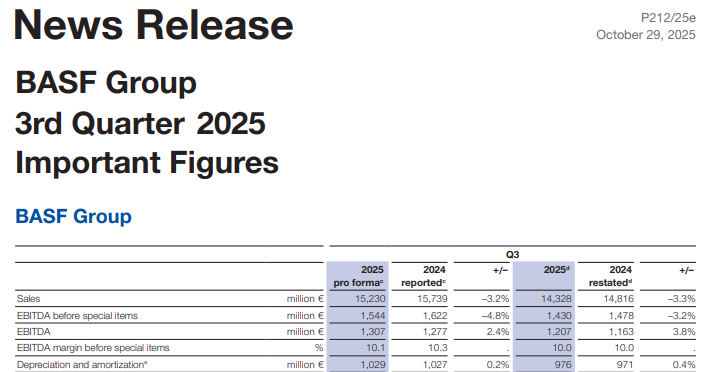
The sales for this quarter were 14.3 billion euros (15.2 billion euros before adjustment), a decrease of 3% compared to 14.8 billion euros in the same period last year (15.7 billion euros reported last year). The decline is mainly attributed to two factors: first, the adverse effects of exchange rate fluctuations of major currencies such as the US dollar and the Chinese yuan; second, the decrease in product prices in core business areas such as chemicals and materials.
It is worth noting that the sales growth in the surface treatment technology, chemicals, and materials business areas partially offset the negative impacts mentioned above, while the price increases in the surface treatment technology, nutrition, and care business areas also became an important support for business resilience.
2. Profitability: Slightly exceeded expectations but slightly declined year-on-year, with profit margins remaining stable.
The earnings before interest, taxes, depreciation, and amortization (EBITDA), excluding special items and including discontinued operations, amounted to 1.5 billion euros, a decrease of 78 million euros compared to 1.6 billion euros in the same period last year.
After excluding discontinued operations, the figure is €1.4 billion (adjusted from €1.5 billion), a slight decrease from €1.5 billion year-on-year, primarily due to a decline in earnings from industrial solutions and chemicals. However, significant growth in surface treatment technologies and agricultural solutions effectively offset this decline.
The key profitability indicator - the EBITDA margin excluding special items remains flat compared to the same period last year, maintaining at 10%.
In addition, earnings before interest and taxes (EBIT) performed well, reaching €232 million (adjusted €278 million), an increase compared to €191 million in the same period last year; earnings before interest, taxes, depreciation, and amortization (EBITDA) stood at €1.2 billion (adjusted €1.3 billion), remaining roughly flat compared to the same period last year, which includes €200 million in structural adjustment special expenses and special income from business divestitures.
3. Cash Flow and Shareholder Returns: Spending contraction but cash flow under pressure, buybacks implemented early.
The cash flow from operating activities was 1.4 billion euros, a decrease of 681 million euros compared to the same period last year, primarily affected by changes in other operating assets. Capital expenditure has significantly contracted, with expenditures on intangible assets and real estate amounting to 973 million euros this quarter, a decrease of 510 million euros compared to the same period last year, leading to free cash flow of 398 million euros (a year-on-year decrease of 171 million euros).
Based on the cash proceeds from business portfolio adjustments, the Group announced the early launch of a share buyback program: with an upper limit of 1.5 billion euros, it will officially start in November 2025 and is expected to end by the end of June 2026. This program is part of the 4 billion euro buyback plan announced in September 2024, which was originally scheduled to start by 2027 at the latest. The early implementation highlights management's confidence. BASF Group will cancel all repurchased shares, thereby reducing the share capital accordingly.
Business Adjustment: Paint Business Spin-off Reshapes Financial Statements, Initial Results of Strategic Focus Emerge
The interpretation of this quarter's financial data needs to incorporate a key accounting adjustment: pursuant to IFRS 5, following the agreement on a €7.7 billion transaction with Carlyle Group, BASF's OEM coatings, automotive refinish coatings, and surface treatment business will be classified as discontinued operations starting September 30, 2025.
This adjustment brings about three changes to the financial statements: first, the sales and revenue of this business will no longer be included in the core metrics of the Group and the Surface Technologies business area; second, its after-tax profit will be separately disclosed starting January 1, 2025; third, the data for the same period in 2024 has been retrospectively adjusted. This transaction is expected to generate approximately 5.8 billion euros in pre-tax cash gains for BASF, and the Group will retain a 40% stake, a key move under the "Winning with Strategy" to unlock the value of "autonomous businesses."
Dr. Martin Brudermüller, Chairman of the Executive Board of BASF Group, pointed out: "Customer purchasing behavior remains cautious across almost all industries and regions. Nevertheless, the group's earnings slightly exceeded market expectations, demonstrating the effectiveness of our business structure optimization." Chief Financial Officer Dirk Elvermann added: "The early implementation of the share buyback plan fully reflects the management's confidence in BASF's potential financial strength and true value."
Based on the accounting treatment adjustments for the separation of the coatings business, BASF has updated its full-year 2025 performance forecast while maintaining its original assumptions about the global economic environment.
1. Macroeconomic environment assumptions remain unchanged: global GDP growth is expected to be 2.0%-2.5%, industrial production growth rate is 1.8%-2.3%, and chemical production growth rate is 2.5%-3.0%; the average exchange rate of euro to dollar is assumed to be 1:1.15, and the average price of Brent crude oil is expected to be $70 per barrel.
2. Performance forecast adjustment: The expected EBITDA, excluding special items, is revised to €6.7 billion - €7.1 billion (previously €7.3 billion - €7.7 billion), with the adjustment mainly reflecting the impact of the coatings business spin-off.
The expected free cash flow is between 400 million and 800 million euros.
The carbon dioxide emissions are expected to be between 16.7 million and 17.7 million tons, consistent with previous forecasts.
Notably, while divesting part of its coatings business, BASF continues to strengthen its core areas: the production lines for polyester and polyurethane resins at the Shanghai Caojing base have doubled their capacity, with plans to further expand the production capacity of electrocoat emulsions by early 2026. Additionally, the Turkish plant has added a new low-VOC dispersion production line, demonstrating the strategic logic of "exiting the end-user market and focusing on specialty chemicals and green technology."
【Copyright and Disclaimer】The above information is collected and organized by PlastMatch. The copyright belongs to the original author. This article is reprinted for the purpose of providing more information, and it does not imply that PlastMatch endorses the views expressed in the article or guarantees its accuracy. If there are any errors in the source attribution or if your legitimate rights have been infringed, please contact us, and we will promptly correct or remove the content. If other media, websites, or individuals use the aforementioned content, they must clearly indicate the original source and origin of the work and assume legal responsibility on their own.
Most Popular
-

AI Computing Power Demand Ignites Electronic Fabrics! China Jushi Hits Limit Up! Domestic Substitution Welcomes Golden Window
-

Focus on going global! kingfa sci. leads, huitong, preter, and kumho nire follow, china’s modified plastics frenziedly expanding worldwide
-

PA66 Cost and Profit: Broad-Based Weakness in the Feedstock Market Continues to Erode Cost Support for PA66 (202606)
-

Back-to-back major joker moves! covestro’s 1.32 million ton mdi dual-line expansion and hdi acquisition reshape global polyurethane landscape
-

Evonik Parts Ways With The Polyester Business! A Strategic Retreat By A Germany Chemical Giant And The Global Industry Shift


