


August Production Analysis of The Three Major White Goods: Industry Changes Amid Domestic Demand Divergence and Export Pressure
In August 2025, the production data of domestic white goods (air conditioners, refrigerators, washing machines) was recently released by Industry Online.The total scheduled production volume for the three major categories is26.97 million units, down 8.89% month-on-month and 4.9% year-on-year. This data reflects the complex situation of the current white goods market: domestic demand shows a polarized pattern of “two extremes,” while exports continue to face the dual pressures of trade policies and weak global demand.
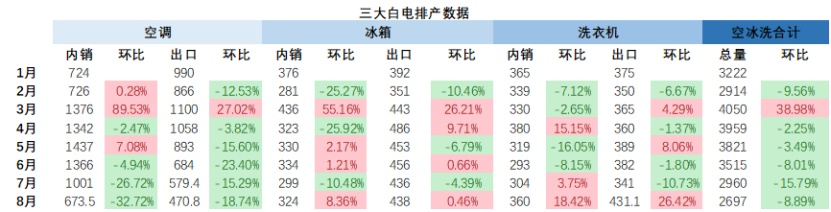
Air conditioners: Domestic sales are polarized, exports are under pressure.
In August, the production of household air conditioners was 11.443 million units, a month-on-month decrease of 27.58%.Compared to the same period last year, production performance has declined. 2.8%. Among them, domestic production scheduling reached 6.735 million units, a sharp month-on-month decline of 32.72%. Although low-penetration markets such as Northeast China experienced significant demand growth due to high temperatures, with Midea air conditioners’ sales in Heilongjiang and Jilin increasing by 356% year-on-year, and Xiaomi air conditioners’ sales in Northeast China reaching 20 times that of the same period last year, sales growth in mature markets such as East China and South China remained steady, reflecting the stage characteristics of the air conditioner domestic market where both existing and new demand coexist. Due to early release of some demand during the June e-commerce promotions, although the high temperatures in July stimulated consumption, domestic production scheduling declined by 22.93% month-on-month. In August, production scheduling decreased by 5.3% year-on-year. Manufacturers have lowered their market expectations for the second half of the year and are cautiously controlling inventory.
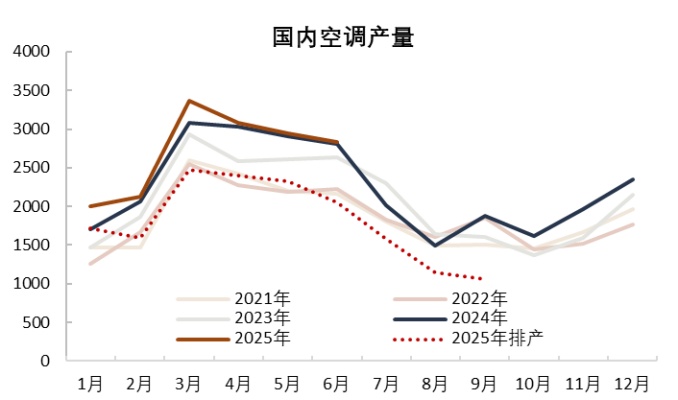
ExportsIn August, the scheduled production for household air conditioner exports was 4.708 million units, a month-on-month decline of 18.74%, marking the fifth consecutive month of decline. The downward trend in production is expected to continue in September and October. Since May and June, the export market has shown a clear downward trend, with declines of varying degrees across all continents except Oceania. The implementation of reciprocal tariff policies in multiple countries, the end of restocking by overseas importers, significant inventory pressures in some regions, as well as geopolitical and logistics issues in the Middle East and Southeast Asia, have all contributed to considerable pressure on the export market.
Refrigerators: Domestic Sales Shrink, Export Divergence
In August, refrigerator production was 7.62 million units, an increase of 3.67% month-on-month.However, compared with the same period last year, production performance has declined. The domestic sales production schedule reached 3.24 million units, an increase of 8.36% month-on-month, but a decrease of 11.5% compared to the same period last year. The early demand pull-forward by the 618 promotional event, coupled with insufficient consumer momentum during the traditional off-season, and extended high-temperature vacations, all contributed to the contraction in domestic refrigerator production schedules year-on-year. In the first half of the year, the refrigerator industry experienced multiple rounds of intense competition and production schedule volatility. In the future, the industry will face challenges such as fragmented channels, diversified demand, product structure upgrades driven by national subsidy policies, and industry adjustments due to the implementation of new energy efficiency standards. The reshuffling process is accelerating, and the reconfiguration of manufacturer structures is intensifying.
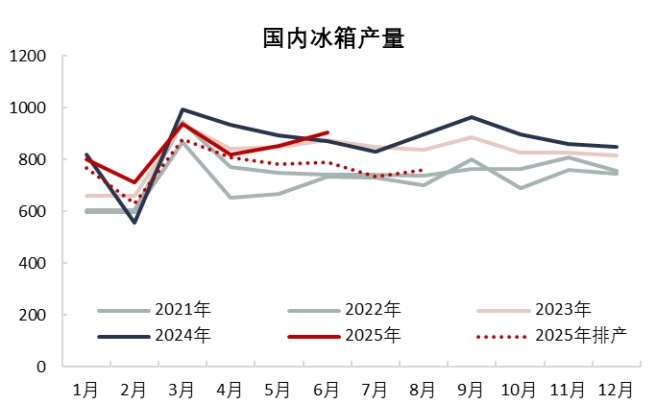
Export Production Scheduling 4.38 million units, a slight month-on-month increase, but an 8.3% decrease compared to the same period last year. Affected by the high base number from the same period last year, tariff policies, market demand, and the summer holidays, exports showed differentiation. Traditional European and American markets were weak, exports to the North American market dropped significantly due to tariff impacts, while emerging markets such as Africa and Latin America became the main drivers of export growth. Changes in the U.S. import structure indicate that China’s market share for refrigerators has significantly declined since May. The global tariff environment has become more complex since August, which will further affect the export pattern of refrigerators.
Washing Machines: Domestic Sales Improving, Export Restrictions Persist
In August, washing machine production was 7.911 million units, an increase of 22.75% month-on-month.Compared to the same period last year, production performance has declined. The domestic sales production plan is 3.6 million units, a month-on-month increase of 18.4%, representing a 6.9% decline compared to the same period last year, showing a good trend with a consecutive month-on-month increase. The expansion of domestic washing machine production capacity, along with a promising performance in the washing and care industry structure, has resulted in an increased proportion of large-capacity and high-priced products. With the support of "national subsidies," the proportion of 12 kg products has increased, and companies are shifting their strategy towards promoting high-end products. The allocation of funds for trade-in programs also significantly boosted the domestic sales production plan in August.
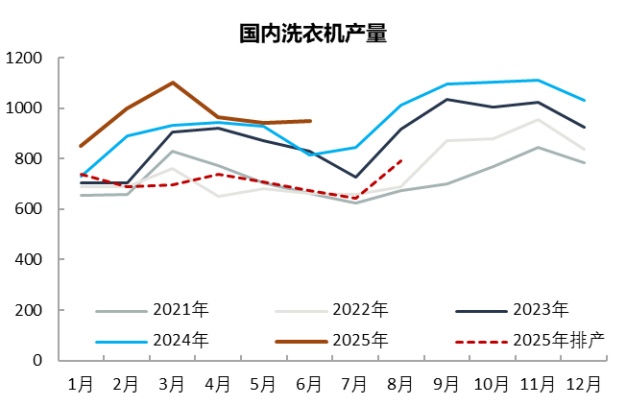
Export Scheduling 4.311 million units, a month-on-month increase of 26.4%, and a slight year-on-year growth of 1.2% compared to the same period last year. In the second half of 2024, washing machine exports will face constraints such as a high base period, trade policies, and technical compliance requirements. The high export base in the second half of 2024 will create pressure, while the U.S. tariff policy on steel household appliances may prompt the EU to follow suit. Additionally, new EU regulations and standards will further increase export barriers.
The production data for white goods in August indicates that the industry is currently experiencing the growing pains of transformation: domestic demand growth relies on dual optimization of regional and product structures, while exports need to cope with significant fluctuations in the trade environment. Against this backdrop, leading companies are seizing opportunities through technological upgrades and global expansion, while small and medium-sized manufacturers may become further marginalized. In the future, policy incentives (such as trade-in programs), upgrades in energy efficiency standards, and the development of emerging markets will become key variables for industry breakthroughs.
Author: Zhuansu Shijie Market Research Expert Zhao Hongyan

【Copyright and Disclaimer】This article is the property of PlastMatch. For business cooperation, media interviews, article reprints, or suggestions, please call the PlastMatch customer service hotline at +86-18030158354 or via email at service@zhuansushijie.com. The information and data provided by PlastMatch are for reference only and do not constitute direct advice for client decision-making. Any decisions made by clients based on such information and data, and all resulting direct or indirect losses and legal consequences, shall be borne by the clients themselves and are unrelated to PlastMatch. Unauthorized reprinting is strictly prohibited.
Most Popular
-

AI Computing Power Demand Ignites Electronic Fabrics! China Jushi Hits Limit Up! Domestic Substitution Welcomes Golden Window
-

Focus on going global! kingfa sci. leads, huitong, preter, and kumho nire follow, china’s modified plastics frenziedly expanding worldwide
-

Back-to-back major joker moves! covestro’s 1.32 million ton mdi dual-line expansion and hdi acquisition reshape global polyurethane landscape
-

Evonik Parts Ways With The Polyester Business! A Strategic Retreat By A Germany Chemical Giant And The Global Industry Shift
-

PA66 Cost and Profit: Broad-Based Weakness in the Feedstock Market Continues to Erode Cost Support for PA66 (202606)


