


Aowei Cloud Network: September Air Conditioner Production Volume Drops Sharply by 12%
1. Market Overview: The Myth of High Growth Ends, Downward Pressure Intensifies
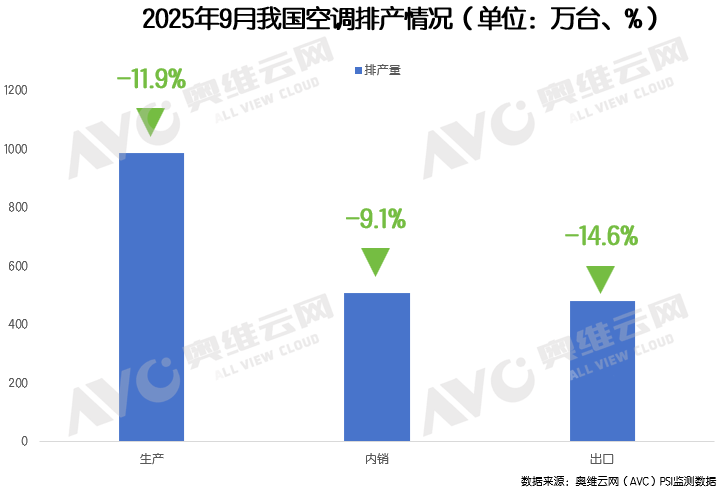
In 2025, the air conditioner market experienced a dramatic turnaround. Driven by sustained high temperatures in June and July, the retail sector saw explosive growth.According to the aggregated data from Aowei Cloud Network, air conditioner retail sales from January to July increased by 16.7% year-on-year, continuing the steady upward trend seen in the first half of the year.However, this "relying on the weather" frenzy came to an abrupt halt in August—the growth rate at the retail end turned negative for the first time. According to weekly data from All View Cloud Network, both online and offline sales declined by 6% and 19% respectively in the first week of August. An even more severe signal came from the production end:According to the latest production scheduling data from Aowei Cloud Network, domestic air conditioner production in September was 5.082 million units, down 9.1% year-on-year, while export production was 4.785 million units, a sharp decline of 14.6%.
2. Domestic Sales Predicament: The Dual Stranglehold of Inventory Pressure and Demand Depletion
1. Inventory devours channel vitality
The significant retail growth in June and July is essentially a concentrated clearance of previous inventories. As of June, the industry's total inventory exceeded 54 million units, with 22.32 million units in factory stock and 31.81 million units in channel stock, far surpassing the healthy level for the industry. High inventory levels directly suppress the willingness of distributors to restock, especially for small and medium-sized distributors who face significant pressure on their cash flow, leading to a substantial decline in channel replenishment enthusiasm.
2. High Base Curse and Demand Exhaustion
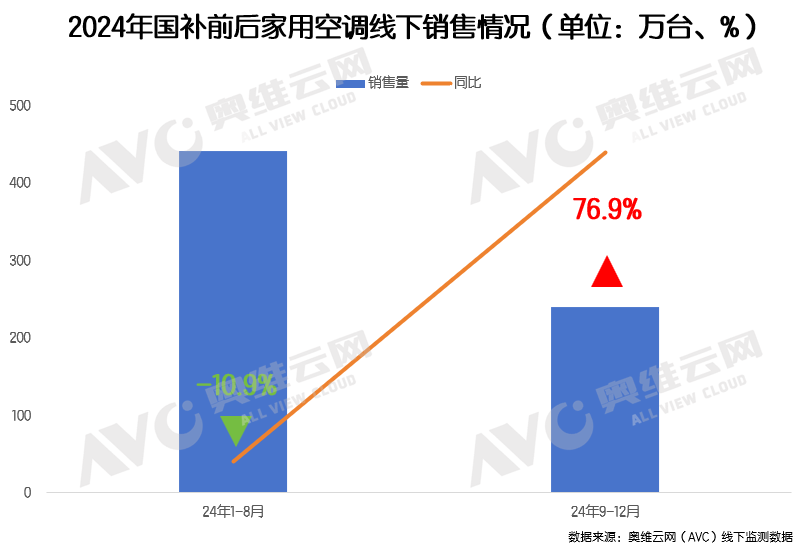
The high base effect formed by the 2024 national subsidy policy is becoming evident. Retail sales from September to December last year surged by 76.9% year-on-year, leading to increased pressure in the second half of this year. Coupled with the previous overdraft in demand, consumer skepticism is prevalent; companies lack confidence in the market for the second half of the year, and the conservative strategies on the production side further exacerbate the situation.
3. Subsidy policies have fallen into an implementation dilemma.
Although the national subsidy policy is still being implemented, feedback from dealers in various regions indicates that its effectiveness on the ground is poor. In some areas, subsidies are distributed in limited quantities and for limited times, resulting in low actual utilization rates, and the policy benefits have not effectively reached the end users. Dealers also face significant financial pressure from advancing funds, which dampens their enthusiasm for promotion. Furthermore, some businesses have adopted a “raise prices first, then subsidize” approach, further diluting the effectiveness of the policy and indirectly suppressing retail activity.
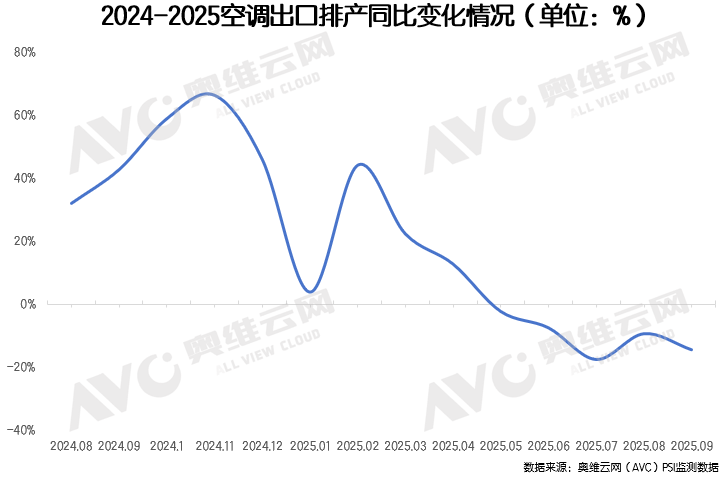
Exports in the cold winter decreased by 14.6% year-on-year.
The overseas market has experienced a year-on-year decline for five consecutive months, mainly due to the end of the global restocking cycle. The overdraft effect caused by early stockpiling in the second half of 2024 will be concentrated and released in 2025. Coupled with the continued tariff issues, the pressure on export costs has not eased, and some orders have been lost to regions like Southeast Asia. Additionally, the European market is affected by competition from local brands and the upgrade of energy efficiency standards, which has weakened the advantages of Chinese products. Although the Southeast Asian market is growing, profit margins are being squeezed by rising costs. In the short term, the downward trend in exports is difficult to change.
5. Conclusion
The decline in production scheduling in September reflects a combination of cyclical adjustment and structural transformation in the air conditioning industry. In the short term, inventory digestion, base effects, and policy implementation issues will continue to suppress the market; in the medium to long term, technological upgrades and the overseas expansion strategy will reshape the competitive landscape. Amid accelerated industry reshuffling, companies with technological advantages and strong channel control are expected to seize opportunities during the adjustment period, accumulating momentum for subsequent recovery.
【Copyright and Disclaimer】The above information is collected and organized by PlastMatch. The copyright belongs to the original author. This article is reprinted for the purpose of providing more information, and it does not imply that PlastMatch endorses the views expressed in the article or guarantees its accuracy. If there are any errors in the source attribution or if your legitimate rights have been infringed, please contact us, and we will promptly correct or remove the content. If other media, websites, or individuals use the aforementioned content, they must clearly indicate the original source and origin of the work and assume legal responsibility on their own.
Most Popular
-

AI Computing Power Demand Ignites Electronic Fabrics! China Jushi Hits Limit Up! Domestic Substitution Welcomes Golden Window
-

Focus on going global! kingfa sci. leads, huitong, preter, and kumho nire follow, china’s modified plastics frenziedly expanding worldwide
-

PA66 Cost and Profit: Broad-Based Weakness in the Feedstock Market Continues to Erode Cost Support for PA66 (202606)
-

Back-to-back major joker moves! covestro’s 1.32 million ton mdi dual-line expansion and hdi acquisition reshape global polyurethane landscape
-

Evonik Parts Ways With The Polyester Business! A Strategic Retreat By A Germany Chemical Giant And The Global Industry Shift


