


“Anti-Involution” Drives China Polyethylene Special Material Production Capacity Upgrade
Since the second half of 2024, under the influence of anti-involution policies, the production capacity of polyethylene specialty materials in China has increased and accelerated its transformation toward high quality. Over the next five years, we expect China's polyethylene industry to overcome the past dilemma of "low-price competition," achieving capacity expansion and product structure optimization.
-
China will accelerate the elimination of outdated production capacity to promote industrial upgrading and structural optimization.
-
Investing in New Areas: Future investments will focus on the high-end new materials sector to enhance product quality and alleviate the pressure of homogenized competition.
The Sixth Meeting of the Central Financial and Economic Affairs Commission held in July clearly required the lawful and regulated governance of enterprises' low-price disorderly competition and promoted the orderly exit of outdated production capacity, providing a policy guideline for the industry to counter "involution."
"Involution-style competition typically refers to enterprises engaging in homogeneous competition through additional capital investment, capacity expansion, price reductions, and other means, ultimately resulting in minimal profits across the entire industry."
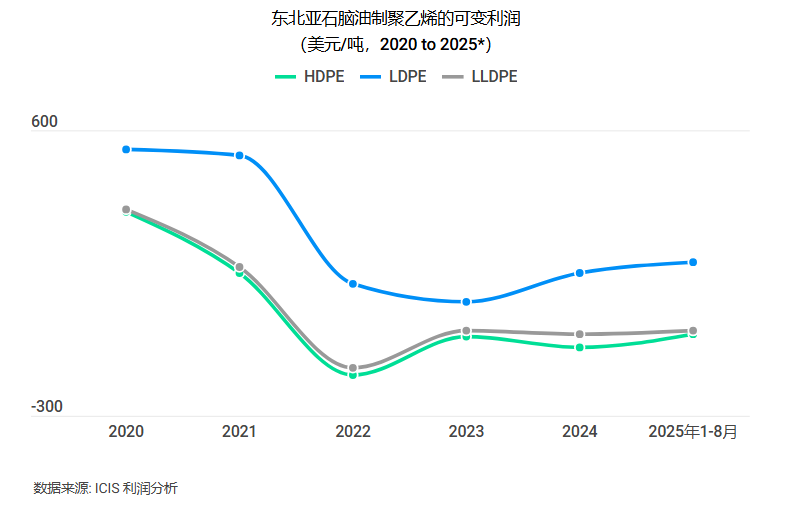
In recent years, with a significant increase in production capacity in China, polyethylene margins in Northeast Asia—especially those for the naphtha-based process—have shrunk considerably. According to the ICIS margin analytics tool, since 2022, the average variable margins for naphtha-based linear low-density polyethylene (LLDPE) and high-density polyethylene (HDPE) have remained at low levels, with the exception of low-density polyethylene (LDPE).
The successive commissioning of new production capacities has driven the continuous increase in China's PE output. From January to July 2025, China's PE production (excluding recycled materials) has exceeded 18 million tons, representing a year-on-year growth of over 13%. With new capacities coming online, output continues to rise—monthly production in July 2025 alone surpassed 2.7 million tons. From September to December 2025, China has plans to commission an additional total of 3 million tons/year of PE capacity (including EVA). However, we expect that the commissioning of most of these projects will be delayed.
According to customs data, China still relies on imports for polyethylene (PE), with net imports of PE from January to July 2025 reaching nearly 7.9 million tons, accounting for about 30% of apparent demand.
China's ethylene industry is ushering in a new wave of capacity expansion. As polyethylene (PE) is a major downstream derivative, it is expected to enter an expansion cycle from 2025 to 2030. Therefore, we anticipate that in the next three years, domestic resources will continue to replace imported resources, while more facilities will face shutdowns.
Some general-purpose production capacities have already been shut down due to structural oversupply and thin profit margins. By the end of 2024, approximately 500,000 tons/year of PE capacity in China is expected to be permanently shut down. From 2025 to 2030, China is expected to announce the closure of about 1.9 million tons/year of PE capacity. However, the pressure from continued supply increases and supply-demand imbalance still persists.
Therefore, market participants anticipate that the "anti-involution" policies will accelerate the elimination of inefficient PE production capacity. In 2027-2028, it is expected that more PE capacity in China will be shut down to ease the imbalance between supply and demand in the market. However, the key to resolving this imbalance lies in accelerating technological upgrades and the development of high-end PE products, shifting the focus of China's PE industry from expanding capacity to improving quality.
With the slowdown of economic growth in various regions and globally, as well as the increasing focus on the concept of a circular economy, the use of single-use plastic products has been restricted or banned, leading to a partial substitution of PE demand by other materials. In addition, due to the decline in China’s birth rate, the growth rate of PE demand has shown a slowing trend.
According to our latest forecast in August, China's PE demand is expected to grow by 5% in 2025, significantly lower than the production growth rate.
PE is mainly used in the packaging industry. Currently, the rapid development of leisure economy sectors such as e-commerce, food delivery services, and tourism has driven the demand for flexible packaging, thereby to some extent boosting the growth of PE demand in China.
With the shift in consumer preferences and the increase in health awareness, there is a growing demand for high-performance and aesthetically pleasing packaging in the fields of cosmetics, skincare products, and fresh food preservation. According to data from the National Bureau of Statistics, the total national online retail sales reached 8.68 trillion yuan from January to July this year, representing a year-on-year increase of 9.2%.
In addition, in line with the carbon neutrality goals and industrial structure adjustment guidance issued by the Chinese government at the end of 2023, we anticipate that policy support in industries such as new energy vehicles, photovoltaic power generation, construction, and textiles will continue to drive the demand growth for PE in emerging fields like photovoltaic films, new energy battery films, and high-performance fibers.
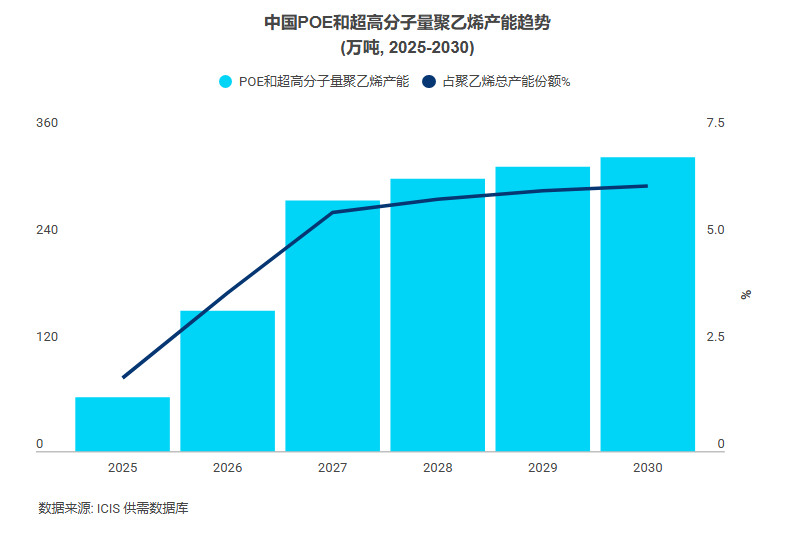
According to ICIS data, by 2030, the production capacity of POE and ultra-high molecular weight PE in China is expected to significantly increase as a proportion of China's total PE production capacity compared to 2025. It is anticipated that with the growth in domestic specialized material output, the influence of Chinese PE products in the international market will also be enhanced. This will further strengthen China's self-sufficiency in PE and lay a foundation for expanding PE product exports.
"Anti-involution" and industry trends are driving structural reforms in China's PE market, accelerating the enhancement of supply-side capabilities. Although there are some challenges in the initial stage, from a long-term perspective, this will promote the market to enter a healthier development phase. The key to improving PE competitiveness lies in technological innovation, product differentiation, and accurately grasping emerging downstream demands.
【Copyright and Disclaimer】The above information is collected and organized by PlastMatch. The copyright belongs to the original author. This article is reprinted for the purpose of providing more information, and it does not imply that PlastMatch endorses the views expressed in the article or guarantees its accuracy. If there are any errors in the source attribution or if your legitimate rights have been infringed, please contact us, and we will promptly correct or remove the content. If other media, websites, or individuals use the aforementioned content, they must clearly indicate the original source and origin of the work and assume legal responsibility on their own.
Most Popular
-

AI Computing Power Demand Ignites Electronic Fabrics! China Jushi Hits Limit Up! Domestic Substitution Welcomes Golden Window
-

Focus on going global! kingfa sci. leads, huitong, preter, and kumho nire follow, china’s modified plastics frenziedly expanding worldwide
-

Back-to-back major joker moves! covestro’s 1.32 million ton mdi dual-line expansion and hdi acquisition reshape global polyurethane landscape
-

Evonik Parts Ways With The Polyester Business! A Strategic Retreat By A Germany Chemical Giant And The Global Industry Shift
-

PA66 Cost and Profit: Broad-Based Weakness in the Feedstock Market Continues to Erode Cost Support for PA66 (202606)


