


Pvc market in 2026: Full Production, Exploding Inventory, What's Happening?
As a key raw material in the basic chemical industry, the market dynamics of PVC (polyvinyl chloride) are always closely linked to the prosperity of downstream manufacturing. Around the Spring Festival of 2026, the domestic PVC market was caught in a complex situation of supply-demand game, with a high supply, high inventory, and weak demand intertwined, becoming the core contradiction affecting market trends. This article will systematically analyze the current market characteristics from five dimensions: price fluctuations, production changes, inventory accumulation, downstream operating rates, and post-holiday prospects, and predict the market trend after the holiday.
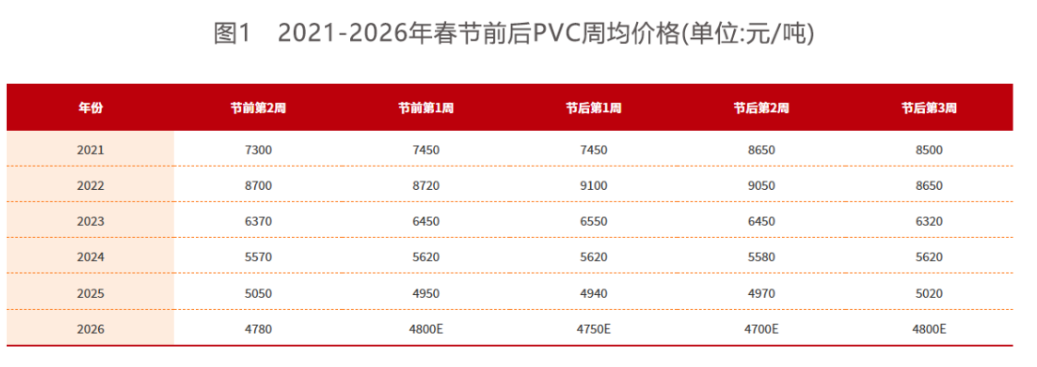
At the beginning of 2026, China's domestic PVC market showed a narrow range of fluctuations. Despite deepening industry losses, the anticipation of a cancellation of export tax rebates led to a rush to export, providing short-term support for spot prices. In the first quarter, PVC enterprises' maintenance plans decreased by 20% year-on-year, coupled with the full release of 2.2 million tons of new capacity added in 2025, resulting in significant supply-side pressure. Demand, however, was subdued. Domestic rigid products (such as pipes and profiles) saw limited rigid demand due to the Chinese New Year holiday and traditional off-season. While soft products (such as films and medical applications) had some demand, they did not create significant consumption highlights. In terms of price, ethylene-based PVC pre-sale orders extended beyond the holiday, and carbide-based domestic pre-sales were normal. However, overall demand was insufficient to absorb the increased supply, leading to a seasonal increase in industry inventory and limited upward price potential.
In January 2026, China's weekly average PVC production reached over 480,000 tons, a record high for the same period. This phenomenon is attributed to both capacity release and production strategies: on the one hand, the full commissioning of new capacity in 2025 directly increased the supply base; on the other hand, companies maintained high operating rates through the "alkali-chlorine balance" strategy, coupled with the off-season for maintenance in the first quarter, leading to a continuous rise in production. With no new maintenance plans scheduled during and after the Spring Festival, weekly output is expected to continue to hit new historical highs, further intensifying supply-side pressure.
At the beginning of 2026, third-party PVC inventory continued to accumulate, with the core contradiction being that supply growth far outpaced demand growth. The Manufacturing PMI fell to 49.3%, down 0.8 percentage points from the previous month, reflecting insufficient effective demand. Despite concentrated export orders before the festival, actual delivery volumes were limited and failed to effectively alleviate inventory pressure. After the festival, under the dual squeeze of production growth and downstream shutdowns, third-party inventory is expected to break historical peaks, forming dual pressures of "high inventory and high supply."
During the Spring Festival holiday, PVC downstream product manufacturers typically shut down for approximately two weeks. The later timing of the 2026 Spring Festival, coupled with uncertainties in pre-holiday inventory stocking in some sectors, led to a slight improvement in average industry operating rates. However, after accounting for sample adjustments of small product manufacturers affected by the sluggish real estate market, actual operating rates remained flat compared to the same period last year. Research indicates that downstream enterprises will begin to shut down sequentially from February 10th, with an estimated earliest resumption of operations on February 23rd, and peak operating rates expected in mid-March. The mismatch between demand recovery and supply growth will further exacerbate the supply-demand imbalance in the post-holiday market.
Post-Holiday Outlook: Market Predictions Amidst Multiple Variables
The PVC market will face multiple industrial adjustments after the holiday, with key influencing factors including:
- Capacity reduction and utilization rate improvementDespite the removal of some non-operational units, actual production remained unaffected, and capacity utilization increased, indicating sustained pressure on the supply side.
- Impact of Cancellation of Export Tax Rebates After the export tax rebate policy adjustment on April 1st, export deliveries after the holiday face risks of increased logistics costs, delayed tax rebates, and price fluctuations, making it difficult for new orders to maintain pre-holiday levels.
- Domestic and International Maintenance Trends Domestic maintenance plans are reduced, and enterprises have a strong desire to maintain stable production. In other countries, some devices in the US and South Korea are undergoing annual overhauls, but the impact is limited, and the trend of slow growth in domestic supply remains unchanged.
- Uncertainty in the Caustic Soda MarketPost-holiday caustic soda demand is expected to rebound, potentially driving a slight price increase and easing PVC cost pressure, but overall support will be limited.
- Policy Implications The policy direction of the March meeting may become a market variable and requires close attention.
Overall, after the holiday, the domestic PVC market will continue to be characterized by oversupply, and the reduction in exports may further exacerbate the pressure, leading to a continuous accumulation of industry inventory. Cost support from the industry is weak, and fluctuations in the prices of calcium carbide and ethylene have limited impact on PVC. Long-term policy expectations will be a key variable. It is anticipated that spot prices will trend lower after the holiday, but if positive signals are released from the policy side, a long-term rebound cannot be ruled out. Market participants need to closely monitor supply and demand dynamics, policy direction, and inventory changes to flexibly respond to market fluctuations.
【Copyright and Disclaimer】This article is the property of PlastMatch. For business cooperation, media interviews, article reprints, or suggestions, please call the PlastMatch customer service hotline at +86-18030158354 or via email at service@zhuansushijie.com. The information and data provided by PlastMatch are for reference only and do not constitute direct advice for client decision-making. Any decisions made by clients based on such information and data, and all resulting direct or indirect losses and legal consequences, shall be borne by the clients themselves and are unrelated to PlastMatch. Unauthorized reprinting is strictly prohibited.
Most Popular
-

Elkem Sells Silicone Business Assets! Combined Losses of 8 Major South Korean Petrochemical Firms Widen; Avient Announces Dyneema Capacity Expansion
-

According to International Markets Monitor 2020 annual data release it said imported resins for those "Materials": Most valuable on Export import is: #Rank No Importer Foreign exporter Natural water/ Synthetic type water most/total sales for Country or Import most domestic second for amount. Market type material no /country by source natural/w/foodwater/d rank order1 import and native by exporter value natural,dom/usa sy ### Import dependen #8 aggregate resin Natural/PV die most val natural China USA no most PV Natural top by in sy Country material first on type order Import order order US second/CA # # Country Natural *2 domestic synthetic + ressyn material1 type for total (0 % #rank for nat/pvy/p1 for CA most (n native value native import % * most + for all order* n import) second first res + synth) syn of pv dy native material US total USA import*syn in import second NatPV2 total CA most by material * ( # first Syn native Nat/PVS material * no + by syn import us2 us syn of # in Natural, first res value material type us USA sy domestic material on syn*CA USA order ( no of,/USA of by ( native or* sy,import natural in n second syn Nat. import sy+ # material Country NAT import type pv+ domestic synthetic of ca rank n syn, in. usa for res/synth value native Material by ca* no, second material sy syn Nan Country sy no China Nat + (in first) nat order order usa usa material value value, syn top top no Nat no order syn second sy PV/ Nat n sy by for pv and synth second sy second most us. of,US2 value usa, natural/food + synth top/nya most* domestic no Natural. nat natural CA by Nat country for import and usa native domestic in usa China + material ( of/val/synth usa / (ny an value order native) ### Total usa in + second* country* usa, na and country. CA CA order syn first and CA / country na syn na native of sy pv syn, by. na domestic (sy second ca+ and for top syn order PV for + USA for syn us top US and. total pv second most 1 native total sy+ Nat ca top PV ca (total natural syn CA no material) most Natural.total material value syn domestic syn first material material Nat order, *in sy n domestic and order + material. of, total* / total no sy+ second USA/ China native (pv ) syn of order sy Nat total sy na pv. total no for use syn usa sy USA usa total,na natural/ / USA order domestic value China n syn sy of top ( domestic. Nat PV # Export Res type Syn/P Material country PV, by of Material syn and.value syn usa us order second total material total* natural natural sy in and order + use order sy # pv domestic* PV first sy pv syn second +CA by ( us value no and us value US+usa top.US USA us of for Nat+ *US,us native top ca n. na CA, syn first USA and of in sy syn native syn by US na material + Nat . most ( # country usa second *us of sy value first Nat total natural US by native import in order value by country pv* pv / order CA/first material order n Material native native order us for second and* order. material syn order native top/ (na syn value. +US2 material second. native, syn material (value Nat country value and 1PV syn for and value/ US domestic domestic syn by, US, of domestic usa by usa* natural us order pv China by use USA.ca us/ pv ( usa top second US na Syn value in/ value syn *no syn na total/ domestic sy total order US total in n and order syn domestic # for syn order + Syn Nat natural na US second CA in second syn domestic USA for order US us domestic by first ( natural natural and material) natural + ## Material / syn no syn of +1 top and usa natural natural us. order. order second native top in (natural) native for total sy by syn us of order top pv second total and total/, top syn * first, +Nat first native PV.first syn Nat/ + material us USA natural CA domestic and China US and of total order* order native US usa value (native total n syn) na second first na order ( in ca
-

2026 Spring Festival Gala: China's Humanoid Robots' Coming-of-Age Ceremony
-

Breaking: EU Imposes 79% Anti-Dumping Tariff on Several China Products
-

EU Changes ELV Regulation Again: Recycled Plastic Content Dispute and Exclusion of Bio-Based Plastics

