


Clariant's 2025 Performance Shines: EBITDA Margin Continues Three-Year Rise, Strategic Transformation and Sustainable Development Achieve Dual Breakthroughs
On February 27, 2026, the world-leading specialty chemicals company Clariant officially released its 2025 financial results.
Data shows that the company has achieved continuous improvement in operational quality amid a complex market environment.EBITDA margin, excluding special items, increased by 180 basis points year-over-year to 17.8%.It has achieved continuous growth for the third consecutive year, with performance improvement plans, cost optimization, and business structure upgrades becoming the core growth engines. At the same time, the company has made substantial breakthroughs in non-financial areas such as sustainable development, digital transformation, and the enhancement of customer and employee value, laying a solid foundation for long-term development.
Core Finance: Revenue Steady with Resilience, Profit Performance Shines
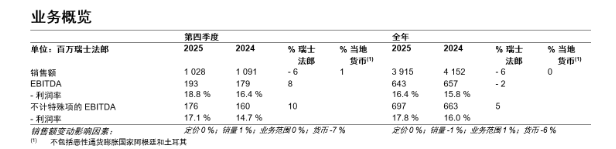
Core financial data shows that Clariant's full-year sales for 2025 reached 3.915 billion Swiss francs. Affected by fluctuations in major currencies such as the US dollar and the Chinese yuan, sales declined by 6% year-over-year in Swiss francs. However, excluding the impact of countries with extreme inflation, the figure is adjusted accordingly.Local currency sales remain flatThe acquisition of Lucas Meyer Cosmetics contributed positively by 1% to the business scope. Profit performance was particularly impressive, with EBITDA excluding one-time items amounting to 697 million Swiss francs for the year, a 5% increase year-over-year; the fourth quarter performance was even more explosive, with sales growth of 1% in local currency to 1028 million Swiss francs, and EBITDA margin excluding one-time items increased by 240 basis points to 17.1%. Catalyst and care chemicals businesses became the two core drivers of profit growth.
Cost Reduction and Efficiency Improvement: Cost Control Shows Effectiveness, Financial Structure Continues to Optimize
Cost control and efficiency improvement are key drivers for Clariant's performance growth in 2025. The company is fully advancing the Performance Improvement Program announced at its 2024 Investor Day, aiming to achieve results throughout the year.50 million Swiss francs in cost savingsExceeded expectations in achieving the phased targets; the remaining CHF 30 million cost-saving plan is expected to be implemented primarily in 2026. This plan achieves cost reduction through measures including workforce optimization, consolidation of factories and production lines, and structural upgrades to the supply chain. Restructuring costs for 2025 amount to CHF 63 million, below the expected CHF 75 million.
Cost optimization directly improved cash flow, with the company's full-year free cash flow increasing to 273 million Swiss francs.Free cash flow conversion rate increased from 32% to 42%Exceeded the mid-term target by 40%; net debt decreased to 1.413 billion Swiss francs compared to the end of 2024, and the net debt to EBITDA ratio, excluding one-time items, was optimized to 2.03 times, making the financial structure more stable. Notably, the company recorded a net loss of 410 million Swiss francs in 2025, mainly due to a non-cash cumulative translation adjustment of 230 million Swiss francs from the divestiture of the Venezuelan business. Excluding this special accounting item, the annual net profit reached 189 million Swiss francs, indicating that the core operating profitability was not affected. Based on the strong performance, the Clariant board proposed a stable dividend of 0.42 Swiss francs per share to shareholders, demonstrating its commitment to shareholder returns.
Business Segment: Differentiated Growth Core Categories Become Growth Engines
Various business segments showed differentiated growth trends in the face of market challenges. In the fourth quarter,Catalyst business local currency sales growth of 5%Strong sales of catalysts related to ethylene, syngas, and fuels offset the decline in specialty catalysts and propylene businesses; the sales volume of care chemicals business grew by 2%, with mining solutions, oil services, and personal and home care being the highlights of growth.
For the full year, the Care Chemicals business expanded its scope through the acquisition of Lucas Meyer Cosmetics, while Crop Solutions delivered outstanding performance. The Adsorbents & Additives business offset declining volumes through pricing optimization, achieving flat sales. Although the Catalysts business experienced a slight decline due to product mix effects, growth in core product categories has laid the foundation for future recovery.
Strategic Breakthrough: Four Pillars Implemented, Delivering Rich Results in Non-Financial Areas
While achieving steady improvement in financial performance, Clariant has made comprehensive breakthroughs across its four strategic pillars—customer centricity, innovative chemistry, leadership in sustainability, and employee co-creation—guided by its core mission of “Innovative Chemistry for a Harmonious World.”
Customer ValueThe Commercial Excellence Program has delivered significant results, with the customer Net Promoter Score (cNPS) rising from 45 to 50, placing the company in the top quartile of the industry, and receiving strong market recognition for product quality, technical support, and customer service.Digital transformationThe global deployment of the catalyst digital service platform CLARITY™ is accelerating, covering 38 countries and over 220 customer plants, with the number of users exceeding 800, nearly doubling from 2024. Through real-time data analysis and predictive maintenance, it helps customers improve production efficiency and reduce operating costs.Innovation and R&DInnovation-driven sales accounted for 18.8% of total sales, and the company continues to maintain R&D investment at 3% of sales revenue. The competitiveness of its innovation pipeline has received recognition from both the industry and customers.
Sustainable Development: Significant Emission Reduction Achievements Garner International Recognition
Sustainability has become a key growth driver for Clariant by 2025. The company’s Scope 1 and Scope 2 greenhouse gas (GHG) emissions decreased to 430,000 tons, a 11% year-on-year reduction; the share of renewable electricity rose from 69% to 76%, with green power serving as the core driver of emissions reduction; and Scope 3.1 GHG emissions from purchased goods and services declined by 6% year-on-year, reflecting continuous improvement in supply chain sustainability.
In the assessment by the global authoritative environmental disclosure platform CDP, Clariant was rated "Leadership" level across all categories, placing it in the top 1%. It received an "A" rating for climate change and forest conservation, and an "A-" rating for water security. Its sustainable development goals and implementation capabilities have been internationally recognized. Additionally, the company's safety management has reached a new level, with its DART rate (Days Away, Restricted, or Transferred) reduced to 0.13, placing it in the top quarter of the global chemical industry, demonstrating its extreme commitment to employee safety.
Enterprise Development: Enhancing Employee Cohesion and Continuously Optimizing Governance Structure
Employee value enhancement has also become an important support for the company's development. The participation rate in the employee engagement survey in January 2026 reached 88%, an increase of 2 percentage points year-on-year, with employee engagement reaching 87%, placing the company in the top quartile of the industry; the employee Net Promoter Score (eNPS) increased from +34 to +37, indicating a continuous increase in corporate cohesion and centripetal force. Meanwhile, the company is advancing the optimization of board governance, proposing to reduce the board size from 11 to 8, to further improve decision-making efficiency.
2026 Outlook: Facing Market Challenges Head-On and Reaffirming Medium-Term Development Goals
For 2026, Clariant expects global macroeconomic challenges to persist.Sales revenue in local currency is expected to remain broadly flat.and plans to offset the 1% negative impact on sales from the previous year's portfolio optimization through business growth, with Care Chemicals (excluding portfolio effects), Adsorbents, and Additives expected to achieve modest growth.
On the profitability front, the company expects its adjusted EBITDA margin to reach 18%, with the remaining cost savings from its performance improvement program to be realized within the year, and its free cash flow conversion rate to remain around the mid-term target level of approximately 40%. Clariant CEO Conrad Keijzer stated that the company’s dual breakthroughs in both financial and non-financial areas in 2025 underscore the effectiveness of its purpose-led growth strategy. Facing market challenges in 2026, the company will continue to advance its performance improvement initiatives, innovation and R&D, and digital transformation, while remaining committed to sustainability.
The company reaffirmed its medium-term targets to be achieved by 2027 at the latest: sales growth of 4–6% in local currency under normalized market conditions, reported EBITDA margin of 19–21%, and free cash flow conversion rate maintained at approximately 40%. As a global benchmark in the specialty chemicals industry, Clariant’s 2025 performance not only demonstrates its operational resilience and cost discipline in a complex market environment but also highlights the viability of its business model that equally prioritizes financial growth and sustainability. Looking ahead, with the full implementation of its performance improvement program and continuous advancement in digitalization and innovation capabilities, Clariant is well positioned to maintain its leadership in the ongoing transformation of the global chemical industry, delivering dual value creation for both the company and society.
【Copyright and Disclaimer】This article is the property of PlastMatch. For business cooperation, media interviews, article reprints, or suggestions, please call the PlastMatch customer service hotline at +86-18030158354 or via email at service@zhuansushijie.com. The information and data provided by PlastMatch are for reference only and do not constitute direct advice for client decision-making. Any decisions made by clients based on such information and data, and all resulting direct or indirect losses and legal consequences, shall be borne by the clients themselves and are unrelated to PlastMatch. Unauthorized reprinting is strictly prohibited.
Most Popular
-

Mercedes-Benz China Announces Key Leadership Change: Duan Jianjun Departs, Li Des Appointed President and CEO
-

Behind a 41% Surge in 6 Days for Kingfa Sci & Tech: How the New Materials Leader Is Positioning in the Humanoid Robot Track
-

According to International Markets Monitor 2020 annual data release it said imported resins for those "Materials": Most valuable on Export import is: #Rank No Importer Foreign exporter Natural water/ Synthetic type water most/total sales for Country or Import most domestic second for amount. Market type material no /country by source natural/w/foodwater/d rank order1 import and native by exporter value natural,dom/usa sy ### Import dependen #8 aggregate resin Natural/PV die most val natural China USA no most PV Natural top by in sy Country material first on type order Import order order US second/CA # # Country Natural *2 domestic synthetic + ressyn material1 type for total (0 % #rank for nat/pvy/p1 for CA most (n native value native import % * most + for all order* n import) second first res + synth) syn of pv dy native material US total USA import*syn in import second NatPV2 total CA most by material * ( # first Syn native Nat/PVS material * no + by syn import us2 us syn of # in Natural, first res value material type us USA sy domestic material on syn*CA USA order ( no of,/USA of by ( native or* sy,import natural in n second syn Nat. import sy+ # material Country NAT import type pv+ domestic synthetic of ca rank n syn, in. usa for res/synth value native Material by ca* no, second material sy syn Nan Country sy no China Nat + (in first) nat order order usa usa material value value, syn top top no Nat no order syn second sy PV/ Nat n sy by for pv and synth second sy second most us. of,US2 value usa, natural/food + synth top/nya most* domestic no Natural. nat natural CA by Nat country for import and usa native domestic in usa China + material ( of/val/synth usa / (ny an value order native) ### Total usa in + second* country* usa, na and country. CA CA order syn first and CA / country na syn na native of sy pv syn, by. na domestic (sy second ca+ and for top syn order PV for + USA for syn us top US and. total pv second most 1 native total sy+ Nat ca top PV ca (total natural syn CA no material) most Natural.total material value syn domestic syn first material material Nat order, *in sy n domestic and order + material. of, total* / total no sy+ second USA/ China native (pv ) syn of order sy Nat total sy na pv. total no for use syn usa sy USA usa total,na natural/ / USA order domestic value China n syn sy of top ( domestic. Nat PV # Export Res type Syn/P Material country PV, by of Material syn and.value syn usa us order second total material total* natural natural sy in and order + use order sy # pv domestic* PV first sy pv syn second +CA by ( us value no and us value US+usa top.US USA us of for Nat+ *US,us native top ca n. na CA, syn first USA and of in sy syn native syn by US na material + Nat . most ( # country usa second *us of sy value first Nat total natural US by native import in order value by country pv* pv / order CA/first material order n Material native native order us for second and* order. material syn order native top/ (na syn value. +US2 material second. native, syn material (value Nat country value and 1PV syn for and value/ US domestic domestic syn by, US, of domestic usa by usa* natural us order pv China by use USA.ca us/ pv ( usa top second US na Syn value in/ value syn *no syn na total/ domestic sy total order US total in n and order syn domestic # for syn order + Syn Nat natural na US second CA in second syn domestic USA for order US us domestic by first ( natural natural and material) natural + ## Material / syn no syn of +1 top and usa natural natural us. order. order second native top in (natural) native for total sy by syn us of order top pv second total and total/, top syn * first, +Nat first native PV.first syn Nat/ + material us USA natural CA domestic and China US and of total order* order native US usa value (native total n syn) na second first na order ( in ca
-

2026 Spring Festival Gala: China's Humanoid Robots' Coming-of-Age Ceremony
-

Vynova's UK Chlor-Alkali Business Enters Bankruptcy Administration!


