


Why is ningde times, earning 200 million a day, underperforming the market?
On the evening of October 20th, the leading lithium battery company CATL released its financial report for the third quarter of 2025. From the numbers, it appears to be a "good-looking" report, but upon closer examination, some unusual signals can be found.
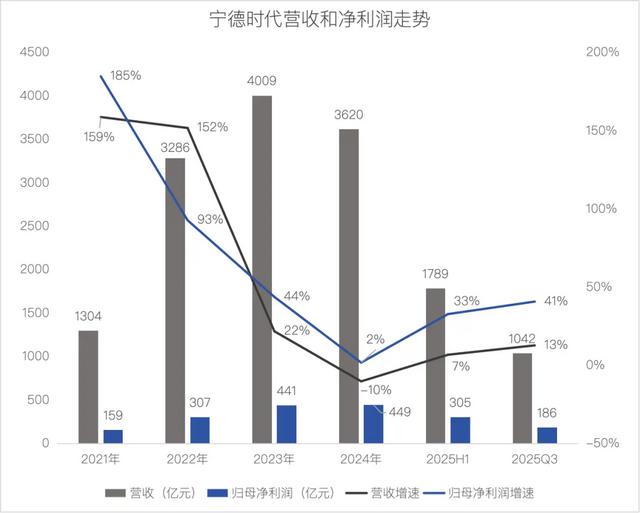
On one hand, profits continue to grow: the net profit attributable to the parent company in the third quarter reached 18.55 billion yuan, an increase of 41.2% year-on-year, equivalent to an average net profit of 210 million yuan per day.
On the other hand, the revenue growth rate is much lower than the profit growth rate: third quarter revenue was 104.19 billion yuan, a year-on-year increase of 12.9%.
In the first three quarters of this year, the gap between CATL's revenue and profit widened: revenue was 283.07 billion yuan, with a year-on-year growth rate of only 9.3%, while net profit attributable to shareholders was 49.03 billion yuan, with a year-on-year growth rate of 36.2%.
More importantly, in the context of the industry's vehicle loading growth rate reaching as high as 42.5%, why did CATL, as a global leader, underperform the market?
Many people would say it's due to industry cycles, price wars, and intensified competition. However, these are likely just surface issues. The real problem lies in why CATL's technological advantage has not continued to translate into market growth.
At the end of the day, this is not a matter of capability but of position. Foxconn is also a technology leader, but it still cannot control the terminal market or define product standards. CATL is technologically advanced and the largest in scale, but as a supplier, no matter how good its technology is, it is still constrained by its customers.
In the industrial chain, those who define the standards have more influence than those who implement them. This might be the ceiling for suppliers.
Profit Soars, Revenue Stalls: What's Happening to "King Ning"?
The most noteworthy aspect of CATL's Q3 financial report is that the net profit growth rate far exceeds the revenue growth rate.
In the third quarter, the net profit attributable to the parent company was 18.55 billion yuan, an increase of 41.2% year-on-year. Looking at this figure alone, it seems quite good. However, when compared to the revenue growth rate (12.9%), it's evident that the profit growth rate is more than three times that.
The net profit attributable to the parent company for the first three quarters (49.03 billion yuan) increased by 36.2% year-on-year, which is about four times the year-on-year revenue growth rate (9.3%) of 283.07 billion yuan.
This means that profit growth mainly does not rely on "selling more," but on something else. So where does the profit come from?
When reviewing the financial report, you will find three areas "contributing" to the profit.
The improvement in gross profit margin is primarily due to the decline in raw material prices.
The price of lithium carbonate used in manufacturing power batteries has declined from its peak in 2022, reducing the cost pressure on CATL. Historical data shows that its gross profit margin increased from 20.3% in 2022 to 22.9% in 2023.
According to the latest financial report, CATL's gross profit margin for the first three quarters of 2025 was 25.3%, which is 0.34 percentage points higher than the same period in 2024. Don't underestimate this 0.34 percentage point increase; in the context of the industry's price war, CATL's ability to maintain a stable or slightly improved gross profit margin indicates that its cost control capabilities are strengthening.
Secondly, interest income has increased.
Contemporary Amperex Technology Co., Ltd. (CATL) has over 360 billion yuan in cash and financial products on its books, equivalent to 7.5 times its net profit for the first three quarters. The interest alone from this amount is a considerable income.
The financial report shows that CATL's financial expenses for the first three quarters were "-7 billion yuan", with the negative number indicating net income, compared to "-2.9 billion yuan" in the same period last year, primarily due to an increase in net interest income. In other words, CATL earned over 4 billion yuan more just from interest income.
The third is that investment income has increased.
CATL's investment income for the first three quarters was 5.24 billion yuan, 2.1 billion yuan more than the same period last year. This is mainly because the companies in which CATL holds shares performed well, thereby increasing the investment income accordingly.
Ningde Times' net profit growth mainly relies on cost reduction, interest income, and investment gains, rather than business expansion.
The growth rate on the revenue side has obviously slowed down.
CATL's business is mainly divided into two segments: power batteries and energy storage batteries. Power batteries account for about 70% of the revenue and are the core business.
According to data from the China Automotive Power Battery Industry Innovation Alliance, the installation volume of China's power battery industry in the first three quarters of 2025 increased by 42.5% year-on-year.
Roughly comparing: the industry is racing ahead at a speed of 42.5%, while CATL is only growing at 6.8%.
The reason for such a large gap is mainly due to its declining market share in the power battery sector.
In September 2025, CATL's installed capacity in the Chinese market was 32.51 GWh, accounting for 42.8% of the industry's total of 76.0 GWh. Looking at the quarterly trend, the overall market share in the third quarter of 2025 was 41.7%, continuing to decline from 44.9% in the first quarter and 42.6% in the second quarter, marking a five-year low.
Although the data for September, being a peak sales season, showed a slight rebound compared to the Q3 quarterly data, both figures reflect one point compared to the full year 2024 figure of 45.2% (CarNewsChina): CATL still maintains the industry lead, but its market share is declining, and this is not just a random fluctuation.
It should be noted that in 2020-2021, CATL maintained a market share of around 50% for two consecutive years. This means that the proportion of industry growth captured by CATL is decreasing.
Secondly, the drag from the energy storage business.
CATL's energy storage business is highly anticipated by the capital market, but it is currently in a "ramping up" phase. This business experienced negative revenue growth in both 2024 and the first half of 2025.
The competition in the energy storage market is fiercer than in the electric vehicle battery sector, with more brutal price wars. Moreover, the marketization level is lower than that of electric vehicle batteries, with many projects relying on policy subsidies and unclear profit models.
At this point, the answer is clear: CATL's profits are rising, but its electric vehicle battery business is underperforming compared to the market, its energy storage business is experiencing negative growth, and overall growth has hit a bottleneck.
The ceiling of suppliers: strong but without a voice.
Why did CATL slow down when the industry was experiencing rapid growth?
To answer this question, we need to look beyond the financial report figures and see where CATL stands in the industry chain.
As of now, let's start with a market value comparison. Tesla's market capitalization is $1.49 trillion, while CATL's market capitalization in Hong Kong stocks is HKD 2.48 trillion (approximately USD 318 billion). Tesla's market value is nearly five times that of CATL.
Is this gap reasonable? From a technical standpoint, CATL's battery technology is not inferior to Tesla's. The energy density of the Qilin battery reaches 255Wh/kg, and the Shenxing ultra-fast charging can achieve "10 minutes of charging for a 400-kilometer range." The condensed matter battery has even achieved an energy density of 500Wh/kg at the laboratory level. On the other hand, Tesla's 4680 battery does not show a clear advantage in terms of technical specifications.
The reason the market gives Tesla a higher valuation is not due to technology, but rather its position in the supply chain.
Tesla controls the entire industry chain: from batteries to complete vehicles, from software to services, from charging networks to autonomous driving. It not only produces electric vehicles but also defines what a "good electric vehicle" is. The 4680 battery, supercharging network, and FSD autonomous driving system are all standards defined by Tesla.
CATL is a supplier of batteries to car manufacturers. Although it has leading technology, it cannot dominate the pace of the supply chain. After the development of the Qilin Battery and Shenxing Supercharging, whether they can be installed in vehicles, how many vehicles they can be installed in, and when they can be installed still require the "nod" from customers, in coordination with the car manufacturers' new car development and redesign cycles.
The gap between setting standards and implementing standards. The role of a supplier that CATL occupies inherently comes with some difficult-to-overcome limitations.
In the past few years, automakers have indeed been highly dependent on CATL. However, automakers are using various methods, such as "diversified procurement" and developing their own batteries, to reduce this dependency.
The battery accounts for 30%-40% of the total vehicle cost. If a car manufacturer relies on a single supplier for a long time, it means that costs, technology, and supply are all subject to external control.
NIO CEO William Li once publicly calculated that the battery accounts for nearly 40% of the cost of the entire vehicle. With a profit margin of 20%, if NIO manufactures its own batteries, it could achieve an additional approximately 8 percentage points in profit margin.
Other car companies will also calculate this account.
Therefore, capable automakers are introducing second and third suppliers, and even researching and developing their own batteries. Tesla is simultaneously procuring lithium iron phosphate batteries from CATL and ternary lithium batteries from LG Energy and Panasonic, while vigorously promoting its self-developed 4680 battery. In addition to procuring batteries from CATL, Volkswagen has invested in Gotion High-Tech and is building its own battery factories in Europe. Li Auto, XPeng, and NIO are doing the same; besides collaborating with CATL, they are actively introducing Sunwoda, CALB, EVE Energy, and also developing their own batteries.
Lithium carbonate prices have fluctuated dramatically in recent years, putting cost pressure on battery manufacturers. As an industry leader, CATL also finds it difficult to fully and quickly pass on the price pressure to downstream car manufacturers.
This leads to CATL's gross profit margin being significantly pressured when raw material prices rise, and only recovering when raw material prices fall. The high dependence on external factors for profit margins indicates that its control over the supply chain is not strong enough.
Contemporary Amperex Technology Co., Limited (CATL) has a strong technology reserve, covering various existing and future technological routes; it also has a clear scale advantage, with a global market share of 36.8%, far surpassing all competitors.
In the traditional automotive manufacturing industry, suppliers must always operate based on the needs of car manufacturers. No matter how good the technology is, it requires customers to be willing to use it; no matter how large the production capacity is, it requires customers to place orders.
This is the ceiling for suppliers: strong but passive; leading but limited.
Battery Swapping and Going Overseas: Can They Break the Deadlock?
The role of "supplier" is both the comfort zone and the ceiling for CATL. In the long run, the loss of market share, the squeezing of profit margins, and the limitation of valuation are all inevitable.
Contemporary Amperex Technology Co., Limited (CATL) clearly doesn't want to remain just a supplier. Can it break out of the role of "making batteries for others" and become the one "defining the rules of the game"?
Battery swapping services and overseas expansion are the two paths it is exploring.
Battery swapping is the most direct step. The logic is easy to understand: if CATL only sells batteries, it can only passively wait for car manufacturers to place orders. However, if it engages in battery swapping, it can directly interact with end users, manage operational data, and even influence the product design of car manufacturers. Moreover, selling batteries is a one-time deal, while battery swapping services provide continuous revenue.
In 2022, CATL (Contemporary Amperex Technology Co., Limited) established the battery swapping brand EVOGO, placing a significant bet on this path. By the end of 2024, it will be upgraded to "Chocolate Battery Swap," introducing standardized battery swap modules with the goal of covering over 80% of the new energy vehicle models on the market.
In 2025, CATL adjusted its strategy from independent construction to collaborative construction, and successively cooperated with NIO and Sinopec. The goal is to jointly build no less than 500 battery swap stations by 2025, with a long-term target of reaching 10,000 stations.
This is a pragmatic adjustment. However, the biggest obstacle to the battery swapping route is not profitability, nor competition from other technological paths, but rather "whether car manufacturers are willing to join."
Automakers are concerned that if they adopt CATL's battery swapping standards, they will be constrained in core platform design and battery asset management. Without enough automakers joining, scale effects cannot be achieved; however, without sufficient coverage of battery swapping stations, automakers lack the incentive to join.
CATL is also seeking breakthroughs, such as partnering with Didi to promote battery swapping for ride-hailing vehicles and exploring vehicle-to-grid/building-to-grid (V2G/B2G) interactions to earn electricity price spreads or ancillary service revenue. However, in the short term, it's challenging to change the fundamentals of the battery swapping business.
In contrast, overseas expansion, especially capturing the European market, is more realistic.
Looking at the two sets of numbers makes it clear. In the domestic market, CATL's share dropped from 50% to 42.8%. Meanwhile, in the European market, its share increased from around 35% in 2024 to approximately 44% in the first four months of 2025.
To deepen its presence in Europe, CATL will allocate 90% of the funds raised from its Hong Kong stock market listing (approximately 32.5 billion RMB) to the construction of a factory in Hungary. This is its largest overseas investment to date.
Why Europe? First, strong policy certainty. The EU plans to ban the sale of fuel vehicles by 2035, and this goal is unlikely to change easily. Second, local competitors have not yet emerged, leaving a window of opportunity for CATL. Third, building factories locally can circumvent trade barriers. This not only saves money but, more importantly, reduces policy risks.
Considering geopolitical risks (such as the EU’s new battery regulations and other stringent laws), localization costs (the cost of building factories in Europe is 3-5 times higher than in China), and intensified competition (with Korean manufacturers like LG Energy Solution and Samsung SDI vying for the European market), CATL, as a latecomer, also faces challenges in capturing the market.
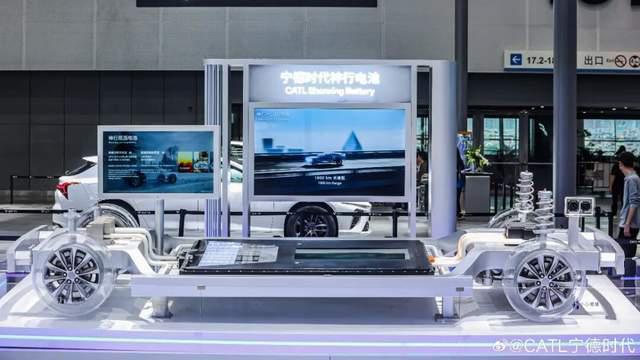
Source of Image / CATL Ningde Times Weibo
The predicament of CATL is essentially a story about "position." This is reminiscent of the comparison between Foxconn and BYD. Foxconn is the world's largest electronics contract manufacturer, but it has always been a "supplier," with profit margins hovering around 3% for years. BYD, starting as a battery supplier, chose vertical integration and began making its own cars.
CATL faces two challenging paths. Battery swapping requires a huge investment with uncertain returns, resembling more of a strategic defense. Going overseas is the most realistic way to hedge against the decline in domestic market share, but there are indeed objective challenges.
The choice of CATL is also a microcosm of the transformation of Chinese manufacturing: whether to continue being the "world's factory" or to climb upstream in the industrial chain to gain a voice.
Every choice has a cost, and also an opportunity.
* The image is sourced from a screenshot of CATL's Weibo.
【Copyright and Disclaimer】The above information is collected and organized by PlastMatch. The copyright belongs to the original author. This article is reprinted for the purpose of providing more information, and it does not imply that PlastMatch endorses the views expressed in the article or guarantees its accuracy. If there are any errors in the source attribution or if your legitimate rights have been infringed, please contact us, and we will promptly correct or remove the content. If other media, websites, or individuals use the aforementioned content, they must clearly indicate the original source and origin of the work and assume legal responsibility on their own.
Most Popular
-

AI Computing Power Demand Ignites Electronic Fabrics! China Jushi Hits Limit Up! Domestic Substitution Welcomes Golden Window
-

Focus on going global! kingfa sci. leads, huitong, preter, and kumho nire follow, china’s modified plastics frenziedly expanding worldwide
-

Back-to-back major joker moves! covestro’s 1.32 million ton mdi dual-line expansion and hdi acquisition reshape global polyurethane landscape
-

Evonik Parts Ways With The Polyester Business! A Strategic Retreat By A Germany Chemical Giant And The Global Industry Shift
-

PA66 Cost and Profit: Broad-Based Weakness in the Feedstock Market Continues to Erode Cost Support for PA66 (202606)


