


U.S. Tariff Hikes and Vessel Fees Impact Plastic Products Exports
lead-in
Trump, under the banner of "America First" and in the name of national security, has sparked a global trade tariff war. The United States remains one of the main destinations for China's plastic products exports. This additional tariff, combined with the tariffs imposed during Trump's first term, has cumulatively reached 45%, significantly impacting China's plastic products exports to the United States.
Trump, under the banner of "America First" and in the name of national security, has launched a global trade tariff war, continuing the approach from his first term. Since 2025, he has imposed two rounds of additional tariffs on all Chinese goods, accumulating to an extra 20% in tariffs. Economically, this is aimed at reducing the trade deficit, maintaining economic advantages, and promoting the return of manufacturing. Strategically, it is about maintaining hegemonic status and curbing China's development. By applying pressure through tariffs and trade barriers, China is not afraid but actively responds, imposing additional tariffs twice on some imported goods originating from the United States. Currently, the United States remains one of the main destinations for China's plastic products exports. With the new round of additional tariffs, combined with those from Trump's first term, the total has reached 45%. This has significantly impacted China's export of plastic products to the U.S. In the future, the export of plastic products to the U.S. will continue to show a trend of reduced volume, and the polyolefin raw material market will be somewhat suppressed due to the weakened external demand for plastic products.
Trump's imposition of tariffs on Chinese exported plastic products
Basic tariff. According to the Harmonized Tariff Schedule (HTS), the basic tariff rates for plastic products in the United States vary depending on the type and use of the product. Generally, the tariff range for plastic products is between 0% and 20%. For common plastic products: such as plastic containers, plastic sheets, plastic pipes, etc., the typical tariff rate is 5%-10%. For high-value-added plastic products: such as medical devices made of plastic, engineering plastic products, etc., there may be lower tariff rates.
Trump 1.0 era, tariff imposition situation. In 2018, the United States imposed multiple rounds of tariffs on Chinese goods exported to the U.S. The plastic products industry was also affected: according to announcements by the Office of the United States Trade Representative (USTR), some plastic products were included in the Section 301 tariff list.
Analysis of China's Export of Plastic Products to the United States Over the Past Five Years
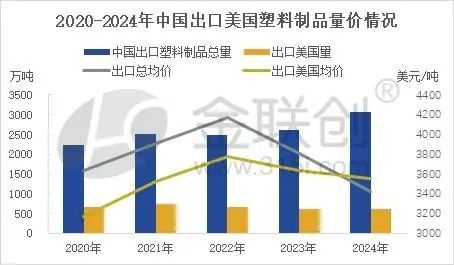
Data source: General Administration of Customs Jinlianchuang
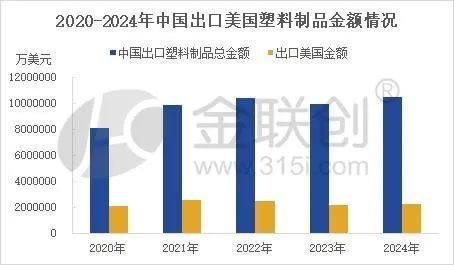
Data source: General Administration of Customs Jinlianchuang
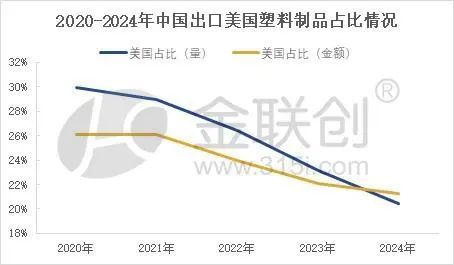
Data source: General Administration of Customs Jinlianchuang
The US imposes restrictions on China's maritime, logistics, and shipbuilding sectors.
China's plastic products exports to the US under increased pressure, polyolefin market bears the brunt
The increase in U.S. tax policies and additional charges on Chinese ships will lead to, first, an increase in export costs. The U.S. raising taxes on imported goods directly leads to an increase in the cost of plastics and downstream products exported from our country to the United States. This increase in cost may compress the profit margins of enterprises, especially those that rely on low-value-added product exports. Additional charges on Chinese ships may further increase logistics costs, which could be passed on to the final product prices, reducing the price competitiveness of our plastics and downstream products in the U.S. market. Second, a decrease in demand. The measures taken by the U.S. to raise taxes and impose additional fees may lead to a decline in the demand for plastics and downstream products exported from our country. Especially for price-sensitive products, consumers may choose other sources or cheaper alternatives. In addition, if the global economic situation is not favorable, these policies may further exacerbate the weakness in market demand. Third, the reshaping of the global supply chain. The U.S. imposing additional charges on Chinese ships may prompt some companies to adjust their global supply chains. For example, companies relying on Chinese exports might turn to other countries or regions to find lower-cost suppliers, which could reduce orders for our plastics and downstream products industry. The impact on the downstream polyolefin industry, as plastic products are widely used in packaging, electronics, automotive, and many other industries. If exports are restricted, it may lead to a reduction in demand from these downstream industries, further affecting the production and sales of plastic products. Particularly, the impact on mid-to-low-end products is greater, such as daily-use plastic items and packaging materials, whose profit margins are small and can hardly bear high tariffs.
Trump views the world from a trader's perspective, unhesitatingly launching tariff wars against allies in Asia, Europe, and North America, using tariffs as part of negotiations and as a means to pressure other countries. However, the consequences also backfire. The OECD has lowered its forecast for U.S. economic growth this year by 0.2 percentage points, while Fitch has cut its forecast for U.S. economic growth this year by 0.4 percentage points. The Federal Reserve minutes released on March 20 showed that the Fed significantly reduced its forecast for economic growth in 2025, while raising its inflation expectations. It lowered the forecast for U.S. economic growth this year from 2.1% expected in December last year to 1.7%, raised the core PCE inflation forecast for this year from 2.5% expected in December last year to 2.8%, and slightly increased the unemployment rate to 4.4%.
In summary, China's plastic products exports to the United States face enormous pressure, but there are also countermeasures. The first is to optimize the product structure, increase the added value of export goods, and develop high-end plastic products to avoid the impact of tariffs. The second is to open up new markets, investing more resources into alternative markets such as the EU and ASEAN, as well as countries along the "Belt and Road." The third is to apply for tariff exclusions; companies can apply for U.S. tariff exclusions (exclusion process), but the process is complex and may not be successful. The fourth is to take advantage of agreement benefits; if China signs free trade agreements with other economies (such as RCEP), it might reduce the tariff burden on other regions. As for the polyolefin market at the raw material end, it will face the reality of a peak in capacity expansion and weak external demand, with the annual price focus shifting downward and volatility decreasing.
【Copyright and Disclaimer】The above information is collected and organized by PlastMatch. The copyright belongs to the original author. This article is reprinted for the purpose of providing more information, and it does not imply that PlastMatch endorses the views expressed in the article or guarantees its accuracy. If there are any errors in the source attribution or if your legitimate rights have been infringed, please contact us, and we will promptly correct or remove the content. If other media, websites, or individuals use the aforementioned content, they must clearly indicate the original source and origin of the work and assume legal responsibility on their own.
Most Popular
-

AI Computing Power Demand Ignites Electronic Fabrics! China Jushi Hits Limit Up! Domestic Substitution Welcomes Golden Window
-

Focus on going global! kingfa sci. leads, huitong, preter, and kumho nire follow, china’s modified plastics frenziedly expanding worldwide
-

Back-to-back major joker moves! covestro’s 1.32 million ton mdi dual-line expansion and hdi acquisition reshape global polyurethane landscape
-

Evonik Parts Ways With The Polyester Business! A Strategic Retreat By A Germany Chemical Giant And The Global Industry Shift
-

PA66 Cost and Profit: Broad-Based Weakness in the Feedstock Market Continues to Erode Cost Support for PA66 (202606)


