


Top Three Independent Carmakers Release Half-Year Reports: Behind the Grand Feast, Incremental Challenges Remain
On September 1st, Zhuansu Vision observed that the three major independent car companies, represented by BYD, Geely, and Great Wall, have all announced their financial reports for the first half of 2025. Meanwhile, the Chinese automotive market is showing a complex situation, with traditional state-owned car enterprises facing transformation challenges, exposing structural contradictions within the industry.
Image source: car seller
Specifically:
BYD: Revenue 371.3 billion yuan, a year-on-year increase of 23.3%, net profit of 15.5 billion yuan, a year-on-year increase of 13.79%, making it the only automaker with net profit exceeding 10 billion yuan. Overseas revenue reached 135.3 billion yuan, accounting for 36.5%, with overseas sales exceeding 550,000 vehicles, surpassing the total sales of last year. The Thailand and Brazil factories began production within the year. Cash reserves stand at 156.1 billion yuan, R&D investment totaled 30.88 billion yuan, a year-on-year increase of 53%, and the number of patents exceeded 39,000.
Geely: Revenue 150.3 billion yuan, a year-on-year increase of 27%, with core net profit attributable to the parent company reaching 6.66 billion yuan, surging 102% year-on-year. Fuel vehicles grew against the trend by 21%, with a market share of 8.8%, ranking first among domestic brands; the new energy segment's Galaxy series sales reached 548,000 units, a year-on-year explosion of 232%. High-end new products such as the Zeekr 9X (luxury pure electric SUV) and Lynk & Co 10 EM-P (B-class plug-in hybrid) are expected to enhance profit margins.
Great Wall: Revenue 92.3 billion, a slight increase of 0.99%; net profit was 6.337 billion, down 10.21% year-on-year. New energy relies on Haval and Pickup; ORA brand sales reached 14,600 units, with two new models costing 1 billion each being highly anticipated. R&D investment was 4.2 billion, and the Hi4 technology system covers all categories, but there are no blockbuster models in the pure electric field.
Source: Great Wall Financial Report
Structural Crisis Behind Industry Prosperity
Although leading private car companies have relatively good performance in the industry, Specialized Vision, upon in-depth observation of the industry, has discovered that there are deep-seated contradictions within the entire industry. From a profit perspective, the price war has severely damaged industry profits. The entire industry's revenue has increased.7.93%, yet net profit increased by only 3.02%. For leading private car manufacturers like BYD, Geely, and Great Wall, their combined profits are still less than half of Toyota's, and their profit growth is clearly lacking.
In terms of R&D investment, there is also a significant imbalance within the industry. BYD's R&D investment proportion has reached...The R&D intensity of 8.3% for one company and 6.6% for Geely contrasts with some state-owned automakers whose R&D intensity is less than 2%. The gap in R&D investment may affect the technological innovation capabilities and market competitiveness of different automakers in the future.
In terms of battery technology, the phenomenon of industry homogenization is quite prominent. Apart from BYD's blade battery, which has a certain degree of uniqueness, other companies'...CTP technology largely depends on suppliers such as CATL. This technological dependence results in enterprises lacking independent innovation and differentiated competitive advantages in the field of battery technology.
There are also shortcomings in the field of intelligence at present.The penetration rate of L2+ level autonomous driving is still less than 30%, indicating that the intelligence level of most vehicles still needs improvement. Although the computing power of Geely's Star Intelligent Computing Center has reached 23.5 EFLOPS, breakthroughs in advanced algorithms are still needed to truly achieve an upgrade in intelligent driving.
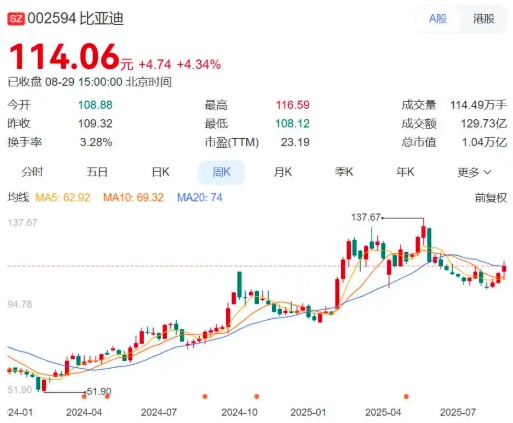
Source of image: Screenshot from the stock forum
The grand banquet of the wealthy still faces challenges of growth.
In response to these industry changes, enterprises with different forms of ownership have adopted differentiated breakthrough strategies. The top three private car manufacturers are all actively pursuing technological breakthroughs. BYD is committed to building...The dual-track barrier of "electrification + intelligence" has led to the installation of the advanced intelligent driving system, Tian Shen Zhi Yan, in 1.2 million vehicles, capturing a certain market share in the smart driving field. Geely has achieved vehicle manufacturing through the SEA architecture, and its Xingyuan model has entered the mass market with a starting price of 68,800 yuan, attracting consumers with its cost-effectiveness. Great Wall's Hi4 technology system covers the market ranging from 100,000 to 400,000 yuan, and its Tank 500 Hi4-Z has pioneered a new category of off-road hybrids, meeting consumers' dual demands for off-road capability and energy efficiency.
From industry data, according to the China Association of Automobile Manufacturers, ...In the first half of 2025, the penetration rate of new energy vehicles reached 50.2%, but the average selling price dropped by 8% year-on-year. In terms of exports, China's automobile export volume reached 3.08 million units, of which new energy vehicles accounted for 34.4%. However, the overseas profit per vehicle was less than 60% of that in the domestic market.
Facing the current industry situation, a consensus has formed within the industry, believing that the next phase of competition will focus on three core capabilities. First, full-stack self-research and development capabilities: automakers need to achieve vertical integration from electric drive systems to intelligent cockpits, mastering core technologies and reducing reliance on external suppliers. Second, global ecological layout, building...A localized system of "R&D - Production - Service" to better adapt to the market demands and policy environments of different regions. Third, reconstruct brand value by breaking through the 200,000 price range, establishing a high-end perception, and enhancing the brand's added value and market competitiveness.
At present, companies such as BYD have demonstrated with data that Chinese automobiles are no longer dependent.The "joint venture dairy cow" model still needs to overcome three major obstacles—R&D investment, brand premium, and global operations—in order to upgrade from the "world's factory" to a "technology lighthouse." The true value of this industry transformation lies not in the financial statements, but in who can establish a benchmark for Chinese automobiles in the realm of uncharted technology.
【Copyright and Disclaimer】The above information is collected and organized by PlastMatch. The copyright belongs to the original author. This article is reprinted for the purpose of providing more information, and it does not imply that PlastMatch endorses the views expressed in the article or guarantees its accuracy. If there are any errors in the source attribution or if your legitimate rights have been infringed, please contact us, and we will promptly correct or remove the content. If other media, websites, or individuals use the aforementioned content, they must clearly indicate the original source and origin of the work and assume legal responsibility on their own.
Most Popular
-

AI Computing Power Demand Ignites Electronic Fabrics! China Jushi Hits Limit Up! Domestic Substitution Welcomes Golden Window
-

Focus on going global! kingfa sci. leads, huitong, preter, and kumho nire follow, china’s modified plastics frenziedly expanding worldwide
-

Back-to-back major joker moves! covestro’s 1.32 million ton mdi dual-line expansion and hdi acquisition reshape global polyurethane landscape
-

Evonik Parts Ways With The Polyester Business! A Strategic Retreat By A Germany Chemical Giant And The Global Industry Shift
-

PA66 Cost and Profit: Broad-Based Weakness in the Feedstock Market Continues to Erode Cost Support for PA66 (202606)


