


The reasons behind saudi aramco's heavy investment in china (including its investment situation in china)
Written by Liu Qing (Consultation and Evaluation Department, China National Chemical Economics and Technology Development Center)
2025 7 6On [Date], the Chinese Ambassador to Saudi Arabia, Chang Hua, paid a courtesy visit to the Saudi Minister of Investment, Khalid.•Falih, the ambassador, stated that the prospects for economic and trade cooperation between China and Saudi Arabia are broad. China is willing to work with Saudi Arabia to earnestly implement this.-The important consensus reached at the fifth meeting of the Saudi High-Level Joint Committee's Subcommittee on Trade, Investment, and Technology promotes the joint construction of the "Belt and Road" initiative and...2030The "vision" is deeply aligned, continuously enriching the connotation of the comprehensive strategic partnership between the two countries. Falih stated that Saudi Arabia is willing to work with China to continuously deepen economic and trade cooperation, continuously expand two-way investment, and welcomes Chinese enterprises to actively participate in various aspects of Saudi Arabia's construction, benefiting the people of both countries.
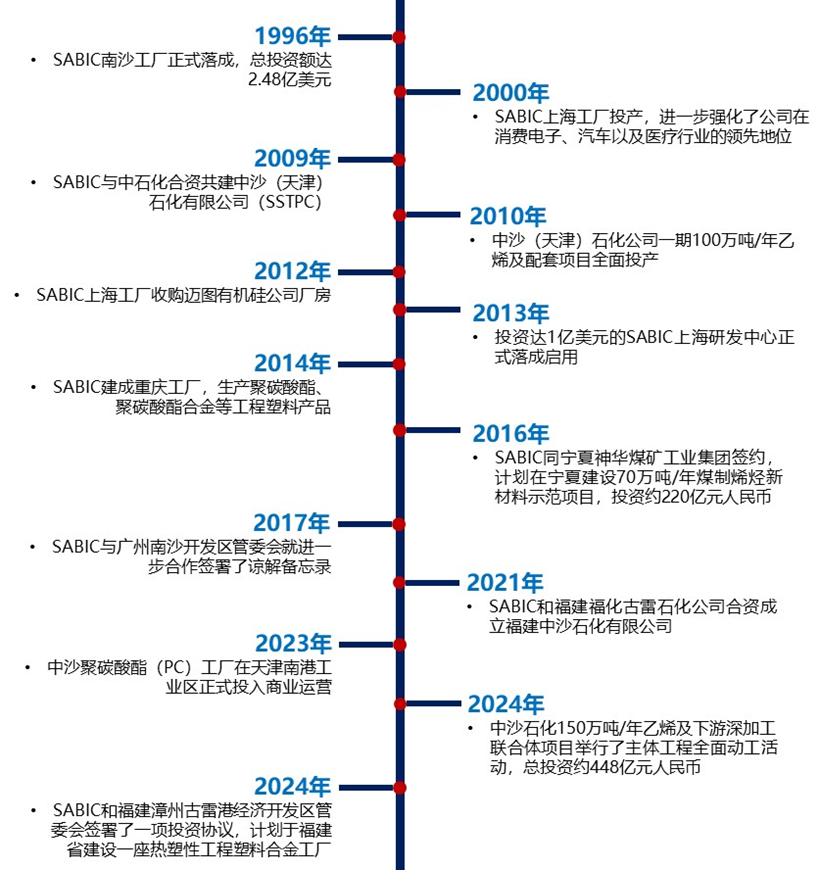
As the only state-owned oil company in Saudi Arabia, Saudi Arabian Oil Company (Saudi Arabian Oil Company,Saudi AramcoIn recent years, Saudi Aramco has been continuously increasing its investments in China. Why do these Middle Eastern "tycoons" frequently invest heavily in China?
01
Saudi Aramco's business segments are divided into upstream and downstream segments. The upstream segment is primarily based in Saudi Arabia and includes the exploration, development, and production of crude oil and natural gas. The downstream segment is spread globally and includes refining, petrochemicals, base oils, lubricants, retail, distribution, trading, and power generation.
Oil fields are the core assets of Saudi Aramco, as well as its core competitiveness and the cornerstone of its internationalization. Saudi Aramco possesses extremely high oil and gas reserves and production.2024By the end of the year, the company's total oil and gas reserves reached a high level.2500Barrels of oil equivalent, including crude oil and condensate reserves.1898Barrels, liquefied natural gas261Barrels, natural gas reserves209.8Trillion standard cubic feet.2025In the first quarter of the year, the company's average oil and gas production was1230.5Barrels of oil equivalent/Day, a year-on-year decrease0.9%The production of liquids (crude oil, liquid natural gas, and condensate) is1030.0 /Day, down year-on-year.2.1%Gas (natural gas and ethane) production is102.5Billion standard cubic feet/Year-on-year growth6.1%。
In terms of the downstream business segment,2024Saudi Aramco's total refining capacity for the year is770 /Day, a year-on-year decrease.2.5%Chemical production capacity is5760 /Year-on-year decrease3.4%。2019 6Month, Saudi Aramco with691Billion dollars from the Saudi Public Investment Fund (PIFPurchase of Saudi Basic Industries Corporation (SABIC)70%This is a win-win-win, transformative transaction. This deal facilitates the expansion of Saudi Aramco's downstream business, including the integration between refining and chemicals, as well as improving the balance of the product mix between fuels and chemicals, providing stable export channels for its crude oil and natural gas. In recent years, the proportion of crude oil processed by Saudi Aramco's downstream business segment relative to the company's crude oil production has been continuously increasing.2019-2024The average annual growth rate of the year-on-year ratio is6.9%。
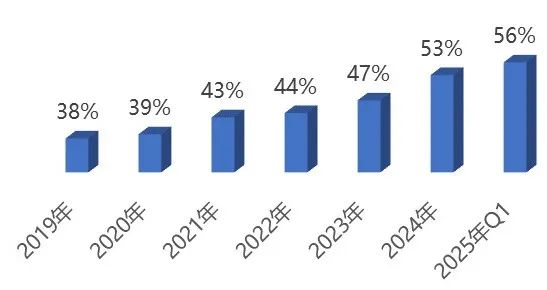
Graph: Proportion of Crude Oil Consumption in Saudi Aramco's Downstream Business
Saudi Aramco needs a stable market for its crude oil products on one hand, and on the other hand, it is accelerating its global expansion in the downstream chemical sector. The company is investing in integrated refining and chemical projects in emerging markets such as China, continuously exploring development pathways in the downstream chemical market, aiming to become a globally leading integrated energy and chemical company, and enhancing the final added value and overall profitability of its crude oil products.
02
International oil prices are influenced by various factors such as supply and demand relationships, economic environment, and political environment, resulting in significant fluctuations. The fluctuation in oil prices also affects the operations of oil companies.
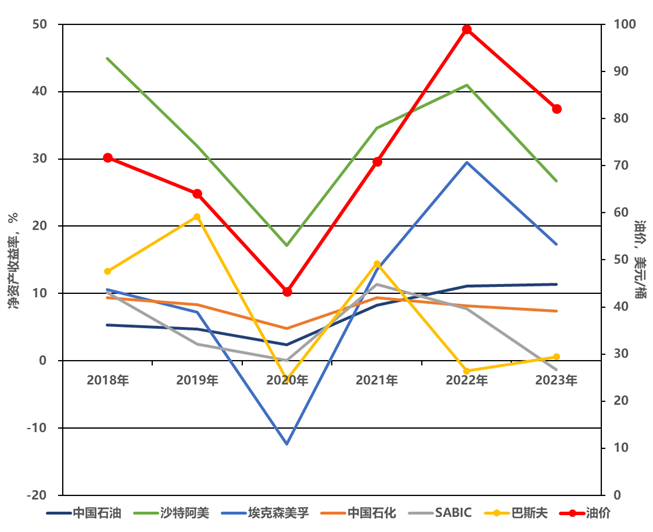
The impact of international oil price fluctuations on the profitability of domestic and foreign oil companies.
It can be seen that the return on equity of oil companies is generally positively correlated with international oil price fluctuations, for example.2020Under the impact of the pandemic, global oil demand plummeted, international oil prices crashed, and the annual average price of international crude oil futures reached43.21 /The barrel has led to poor operating performance for major oil companies.2022The annual average value of global crude oil futures prices for the year is99.04 /The major oil companies have shown good business performance.
Oil price from43.21grow to99.04 /The return on equity of Saudi Aramco from2020 17.12%Add to2022 40.99%。
Of course, similarly for oil companies, those with a larger proportion of downstream business, namely chemical products, such asSABICSinopec and BASF are relatively less affected by oil prices. Chemical products act as stabilizers for oil company products. When oil prices fluctuate significantly, they can serve as a buffer and compensation, thereby enhancing the companies' risk resistance capabilities.
SABICFor example,2018The international crude oil futures price for the year is71.7 / SABICThe return on equity is10.12%,2020When the annual average price of international crude oil futures falls to43.21 /When barreling,SABICThe return on equity is0.04% 2022The annual average price of international crude oil futures rose to99.04 /Bucket time,SABICThe return on equity is7.70%The range of variation is relatively small.
From the graph, it can be seen that at the oil price of60~80 /When it comes to barrel refining, the operational performance of integrated refining enterprises is relatively good, and China Petrochemical Corporation (Sinopec) is no exception.
To better clarify the relationship between the return on net assets of major oil companies and oil price fluctuations, fitting calculations were carried out.2018-2023The linear correlation coefficient between the annual return on equity of petroleum companies and oil prices.
From the table, it can be seen that the return on equity of companies with a large proportion of upstream oil business is highly correlated with oil prices, especially ExxonMobil and PetroChina, with linear correlation coefficients both at.0.9Above.
In contrast, Saudi Aramco's linear correlation coefficient is relatively low, which may be related to its...2019Year of AcquisitionSABICAfter the acquisition, the proportion of chemical products in the company increases, resulting in a reduced correlation between return on equity and oil prices. Conversely, companies with a higher proportion of downstream petrochemical businesses, such as those producing more chemical products like Sinopec,SABICBASF's return on equity is less affected by oil prices, with a low linear correlation coefficient.0.146~0.545。
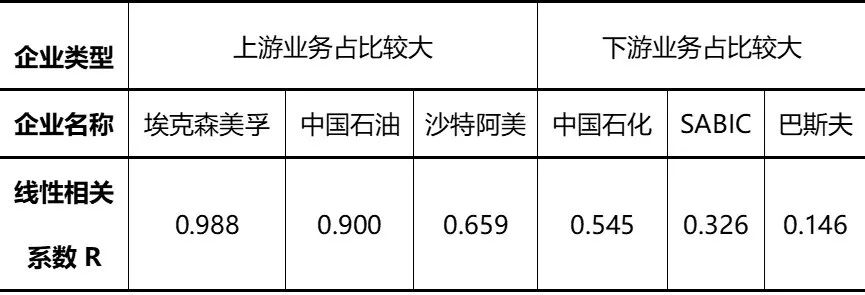
Table: Linear Correlation Between Oil Company Return on Equity and Oil Prices
Therefore, for Saudi Aramco, increasing the proportion of downstream chemical products is its established development strategy. Increasing investment in the downstream chemical industry will help the company enhance its risk resistance.60~80 /A stable oil price per barrel would be the most ideal choice for businesses. Oil price fluctuations bring risks, while stability brings benefits.
Saudi Aramco's cooperation with Chinese refining enterprises is beneficial for leveraging the resource advantages of both parties, resulting in mutual benefit and win-win outcomes. Currently, China is the world's largest crude oil importer, while Saudi Aramco possesses upstream resource advantages. Saudi Aramco needs to expand its downstream business, and China has a mature supporting industry and extensive market advantages. Therefore, the prospects for Sino-Saudi cooperation are bright; this is a story of mutual endeavor.
【Copyright and Disclaimer】The above information is collected and organized by PlastMatch. The copyright belongs to the original author. This article is reprinted for the purpose of providing more information, and it does not imply that PlastMatch endorses the views expressed in the article or guarantees its accuracy. If there are any errors in the source attribution or if your legitimate rights have been infringed, please contact us, and we will promptly correct or remove the content. If other media, websites, or individuals use the aforementioned content, they must clearly indicate the original source and origin of the work and assume legal responsibility on their own.
Most Popular
-

AI Computing Power Demand Ignites Electronic Fabrics! China Jushi Hits Limit Up! Domestic Substitution Welcomes Golden Window
-

Focus on going global! kingfa sci. leads, huitong, preter, and kumho nire follow, china’s modified plastics frenziedly expanding worldwide
-

Back-to-back major joker moves! covestro’s 1.32 million ton mdi dual-line expansion and hdi acquisition reshape global polyurethane landscape
-

Evonik Parts Ways With The Polyester Business! A Strategic Retreat By A Germany Chemical Giant And The Global Industry Shift
-

PA66 Cost and Profit: Broad-Based Weakness in the Feedstock Market Continues to Erode Cost Support for PA66 (202606)


