


Slumping Oil Market Will Spell Disaster for Small Banks in Oil and Gas Regions
In recent years, influenced by geopolitical conflicts, global tariff changes, and adjustments in energy policies, crude oil prices have experienced significant fluctuations. Although media attention often focuses on the impact of oil price volatility on production adjustments by major oil-producing countries and on macro aspects such as international geopolitics, the fluctuations in oil prices also have noticeable effects on many micro-level industries, such as small and medium-sized banks.
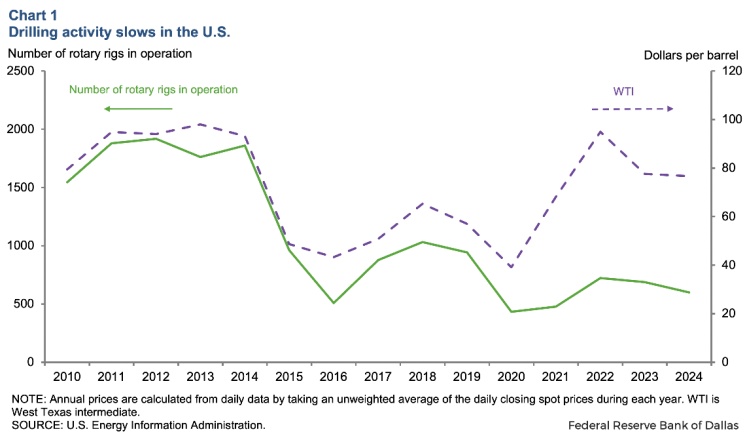
From 2014 to early 2016, innovations in drilling technology and a surge in oilfield activities brought about a booming era for shale gas and tight oil, known as the "shale oil revolution." However, the subsequent plunge in oil prices led to a significant reduction in the number of active drilling rigs.Sorry, but there is no image or content provided for me to translate. Please provide the text or image you want translated.The oil and gas production areas have been severely affected, leading to a deterioration of the local economic situation, which in turn has dealt a severe blow to the banks and financial institutions serving these areas.
Comparison of WTI Crude Oil Prices and Active Rig Count
The energy industry chain, in addition to the chemical-related industries we traditionally consider, also includes upstream extraction industry operations and oilfield services industry. These industries impact the local economy by creating a wide range of employment opportunities, including direct jobs in drilling and production, as well as indirect jobs in supporting industries such as transportation, equipment supply, and hospitality. These industries also contribute to local government revenue through taxes, royalties, and lease payments, which can be used for public services and infrastructure development.
Despite various benefits, the economic returns from oil and gas activities often fluctuate cyclically with oil prices. This volatility can lead to economic instability and trigger cycles of boom and bust in regions highly dependent on oil and gas extraction.
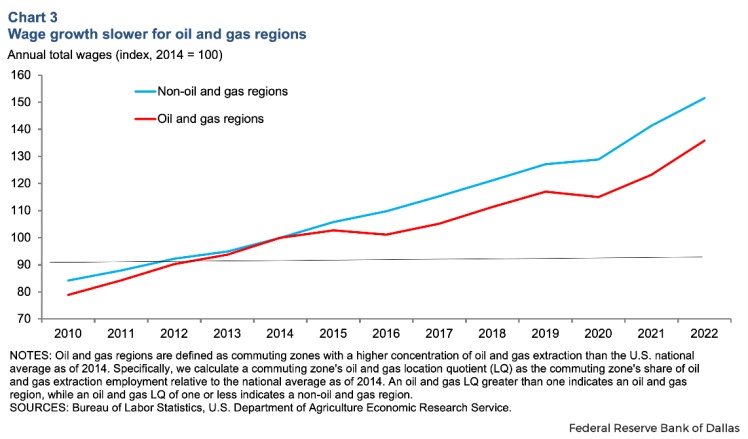
In the United States, for example, in the oil and gas producing regions, the extraction industry actually accounts for only a small portion of the local economy, with the average employment in this industry comprising less than a percentage of the total employment in these areas.Prior to 2014, total employment and private sector wage growth in these areas were stronger than in other regions, despite the relatively small proportion of direct employment, which was below 2.6% in even half of the oil and gas extraction sectors. However, after 2014, employment in these areas...(See below)and salary Growth has again shown a significant slowdown, leading to a noticeable widening of the gap with non-oil and gas regions.
Comparison of Employment in Oil and Gas Producing Areas vs Non-Oil and Gas Producing Areas
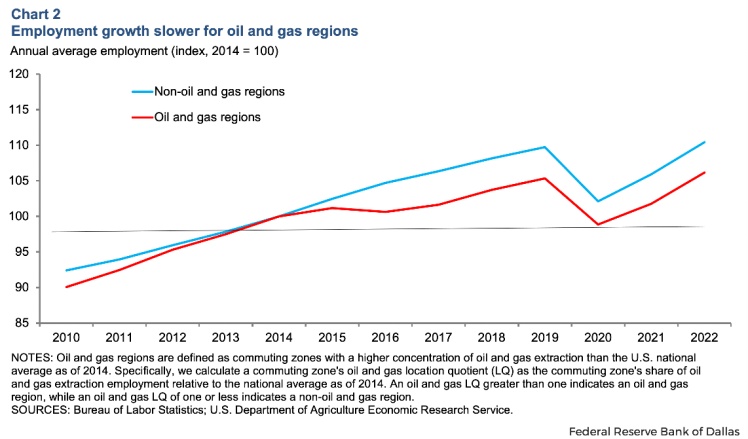
Figure: Wage Comparison Between Oil & Gas Producing Areas and Non-Oil & Gas Producing Areas
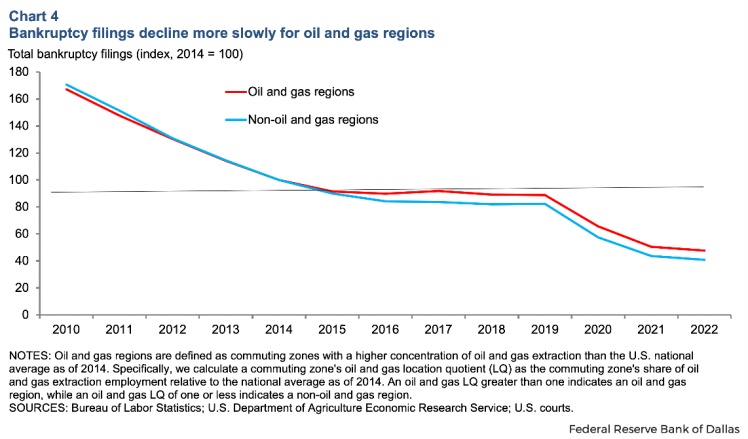
After 2016, prolonged low oil prices reduced the income of oil and gas producing regions and remained weak in the following decade.Sorry, but there is no image or content provided for translation. Please provide the text or image you would like to have translated.The main reason is that the number of consumer bankruptcies remains high.
Figure: Comparison of the number of bankruptcies between oil and gas production areas and non-oil and gas production areas
The economic slowdown in oil and gas producing regions has also affected small banks operating in those areas. These banks typically serve local residents and businesses, focusing on residential and commercial real estate loans. Therefore, these banks are more closely tied to the local economic conditions than large national banks.
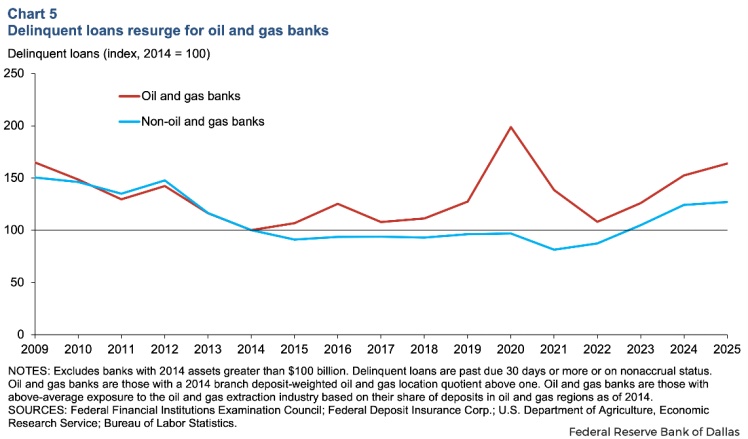
During periods of low oil prices, the overdue loan rate at banks in oil and gas producing regions has increased.The overdue rate of bank loans in non-oil and gas production areas has continued to decline steadily.。
Diagram: Comparison of Bank Loan Delinquency Rates between Oil and Gas Producing Areas and Non-Oil and Gas Producing Areas
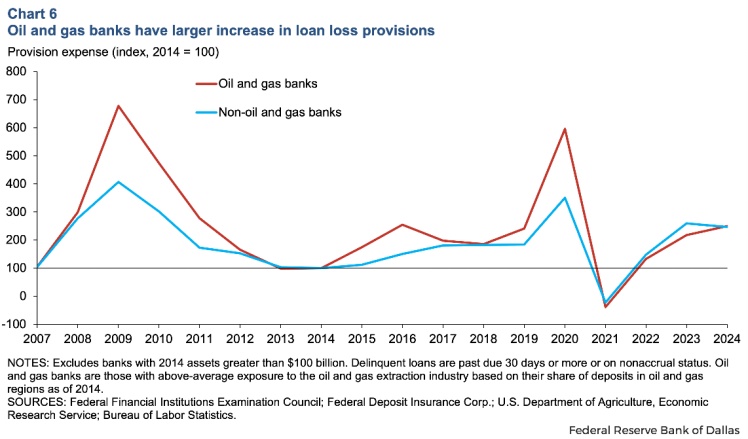
As loan quality deteriorates, these banks have also seen a significant increase in their loan loss provisions, partly due to the decline in the collateral value associated with oil and gas assets.========================================================================。
Figure: Comparison of Loan Loss Provision Expenses between Oil and Gas Producing Areas and Non-Oil and Gas Producing Areas
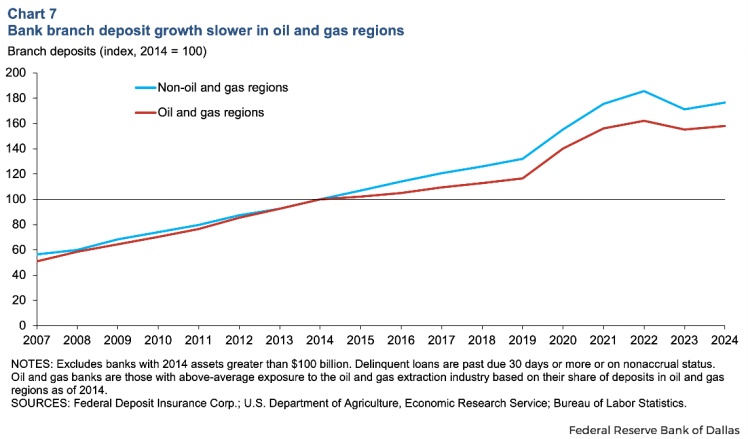
Moreover, during periods of low oil prices, deposits in bank branches in oil and gas producing regions increased.5%, much lower than the 14% increase in non-oil and gas producing areas.I'm sorry, but it seems there is no image provided in your message. If you can describe the content or provide the text you want translated, I would be happy to help with the translation.In addition to asset quality and funding pressures, the slowdown in the local economy also means that the demand for loans and other financial services from these banks is weakening.
Graph: Comparison of Deposit Growth between Oil and Gas Producing Areas and Non-Oil and Gas Producing Areas
The decline in oil prices from 2014 to 2016 did not lead to widespread bank failures, but it did put operational pressure on banks heavily reliant on oil and gas regions. The cyclical nature of the oil and gas industry means these banks are more vulnerable during economic downturns. In 2020, the sharp decline in oil prices due to the pandemic-induced drop in demand once again led to loan defaults and increased reserves for banks in oil and gas regions. Therefore, with the continued slowdown in oilfield activities by mid-2025, a new round of prolonged low oil prices may pose more severe challenges for small banks in these areas.
Author: Gao Xing, Senior Market Analyst

【Copyright and Disclaimer】This article is the property of PlastMatch. For business cooperation, media interviews, article reprints, or suggestions, please call the PlastMatch customer service hotline at +86-18030158354 or via email at service@zhuansushijie.com. The information and data provided by PlastMatch are for reference only and do not constitute direct advice for client decision-making. Any decisions made by clients based on such information and data, and all resulting direct or indirect losses and legal consequences, shall be borne by the clients themselves and are unrelated to PlastMatch. Unauthorized reprinting is strictly prohibited.
Most Popular
-

AI Computing Power Demand Ignites Electronic Fabrics! China Jushi Hits Limit Up! Domestic Substitution Welcomes Golden Window
-

Focus on going global! kingfa sci. leads, huitong, preter, and kumho nire follow, china’s modified plastics frenziedly expanding worldwide
-

Back-to-back major joker moves! covestro’s 1.32 million ton mdi dual-line expansion and hdi acquisition reshape global polyurethane landscape
-

Evonik Parts Ways With The Polyester Business! A Strategic Retreat By A Germany Chemical Giant And The Global Industry Shift
-

PA66 Cost and Profit: Broad-Based Weakness in the Feedstock Market Continues to Erode Cost Support for PA66 (202606)


