


Shipping Companies Begin Raising Prices! Transpacific Freight Rates Surge Again?
This year, the traditional seasonal rhythm of the shipping market has been completely disrupted. Among them, the freight rates for the US route have continued to decline for two consecutive months, and the freight rates for the European route have also shown a weak trend recently. Currently, entering early September, the pressure of capacity supply in the market has eased compared to the end of August, and the downward trend of freight rates may see a temporary slowdown.
As the Golden Week in late September approaches, the market anticipates a surge in shipments, and the US route is expected to experience a short-term transportation peak as a result. However, it is still difficult to accurately predict how freight rates will change subsequently.
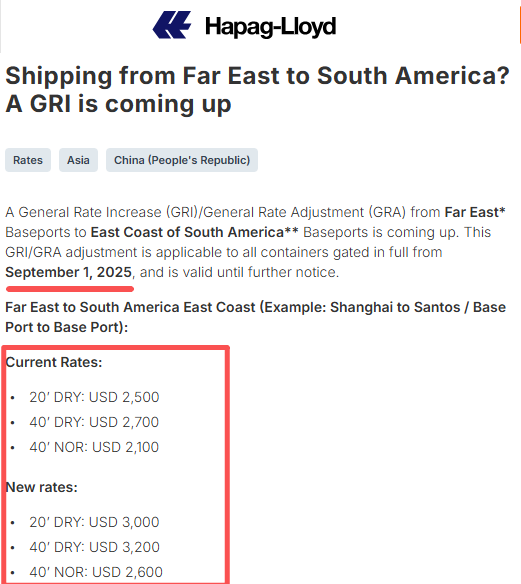
It is worth mentioning that recently some shipping companies have successively announced a new round of freight rate adjustment plans for September. Companies such as Maersk, CMA CGM, and Hapag-Lloyd will make adjustments to the rates on certain routes.
Maersk
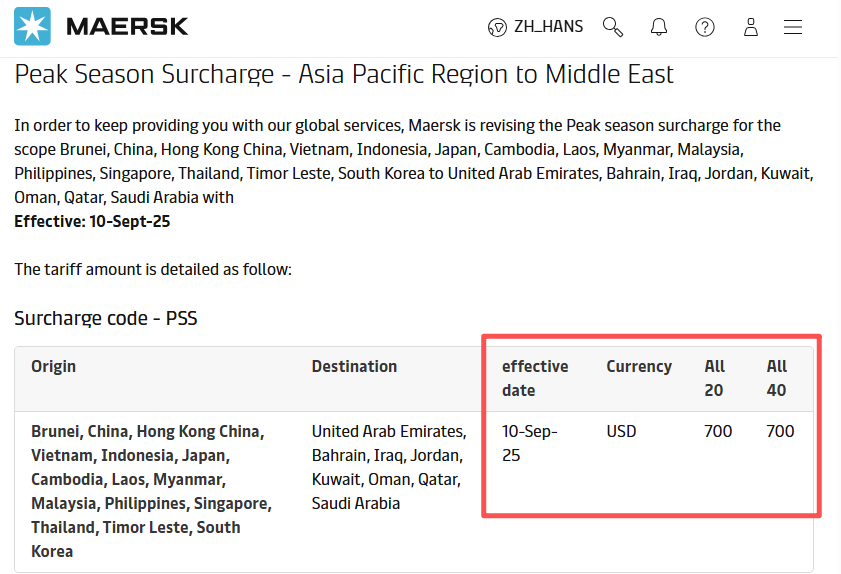
Maersk is adjusting the scope of the Peak Season Surcharge (PSS), announcing the imposition of a PSS from the Asia-Pacific region to the Middle East. Starting from September 10, 2025, a surcharge of USD 700 per container will be levied on shipments from Brunei, China, Hong Kong (China), Vietnam, Indonesia, Japan, Cambodia, Laos, Myanmar, Malaysia, Philippines, Singapore, Thailand, Timor-Leste, and South Korea to the United Arab Emirates, Bahrain, Iraq, Jordan, Kuwait, Oman, Qatar, and Saudi Arabia.
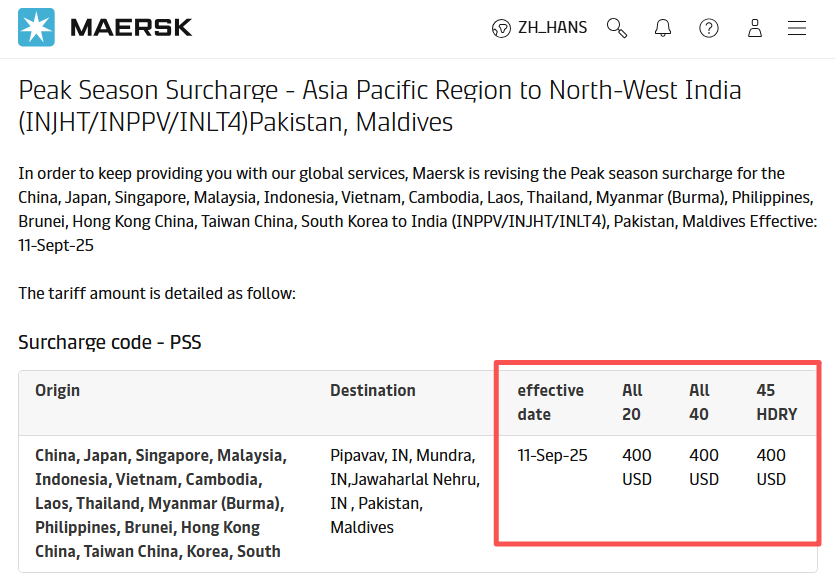
At the same time, Maersk is adjusting the Peak Season Surcharge (PSS) from China, Japan, Singapore, Malaysia, Indonesia, Vietnam, Cambodia, Laos, Thailand, Myanmar, the Philippines, Brunei, Hong Kong (China), Taiwan (China), and South Korea to India (INPPV/INJHT/INLT4), Pakistan, and the Maldives. The effective date is September 11, 2025; a Peak Season Surcharge of USD 400 per container will be applied.
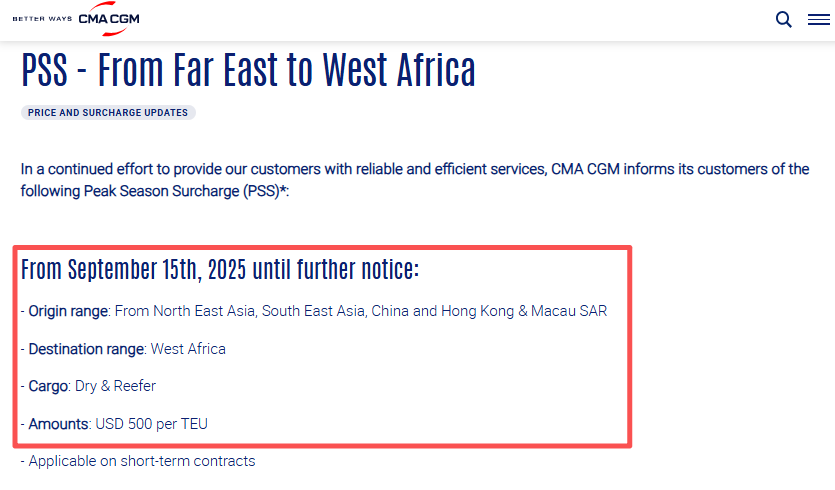
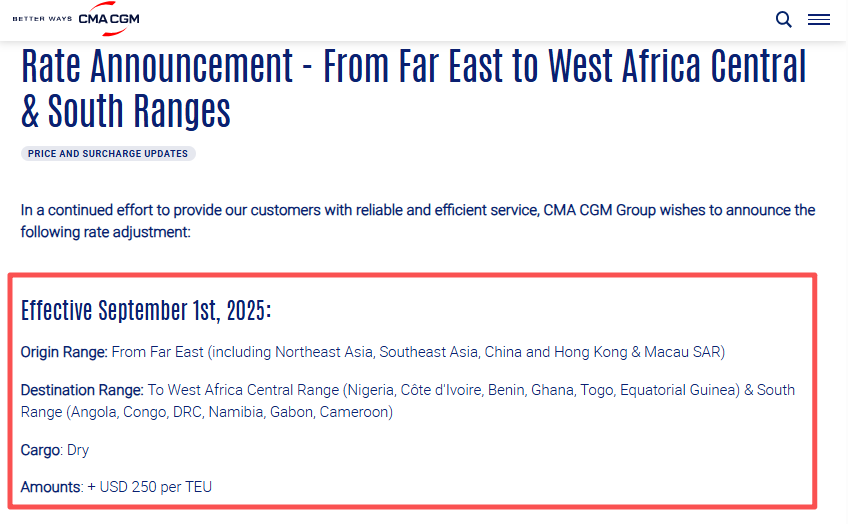
Effective date: From September 15, 2025, until further notice.
Port of departure: Northeast Asia, Southeast Asia, as well as China, Hong Kong Special Administrative Region of China, and Macao Special Administrative Region of China.
Port of destination: Ports in the West Africa region
Applicable goods: dry goods and refrigerated goods
The fee standard: 500 USD per standard container.
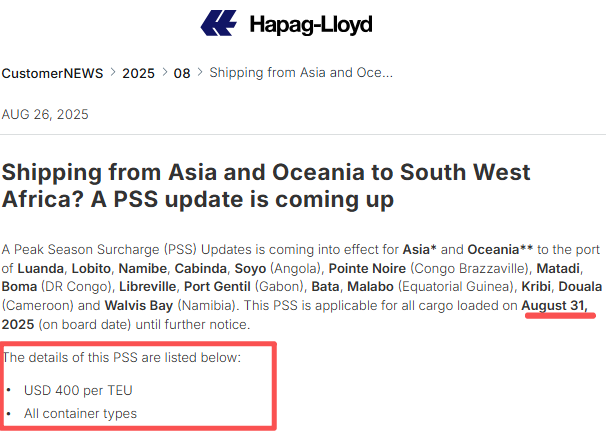
Hapag-Lloyd
Asia-Pacific and Oceania to West Africa
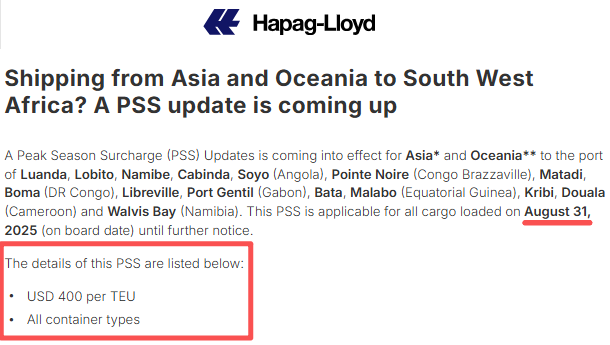
Asia-Pacific and Oceania to Central and West Africa
Far East to East Coast of South America route
U.S. routes may experience a short-term surge in transportation demand.
In the current global trade situation, container shipping on U.S. routes is expected to see a slight recovery in the coming months, potentially experiencing a brief "mini-boom." This is primarily driven by changes in the U.S.-China trade war and new port fee policies.
Recent changes in U.S. trade policy have impacted the global shipping market. Tariffs on China have been suspended until November 10th, maintaining a rate of 10%, while specific product tariffs still exist. There have also been adjustments to tariff policies for countries like Brazil. This uncertainty has made shippers hesitant in their transportation planning. However, with the Christmas shopping season approaching, shippers are under time pressure and are expected to increase shipping volumes in the coming weeks.
A similar situation occurred in May and June this year, where a suspension of tariffs led to a short-term surge in demand and a spike in freight rates. It is expected that the demand for the Pacific route will fluctuate again in August and September. However, shipping companies face challenges in adjusting capacity. For instance, although demand in the North American market is flat this week, liner companies have reduced capacity, resulting in a slight drop in freight rates.
Furthermore, the new port fees following the U.S. Section 301 investigation on Chinese vessels are expected to take effect in October, significantly impacting Chinese shipping companies. To reduce the financial burden, shipping companies may adjust their routes. For instance, COSCO Shipping and its subsidiary, Orient Overseas Container Line (OOCL), might reduce calls at U.S. ports, and OOCL has already announced that its new Pacific route will bypass ports such as Los Angeles.
In the coming months, the demand for U.S. airline transportation will face significant fluctuations. Under the dual impact of the trade war and new fee policies, shipping companies and cargo owners need to closely monitor changes to address market challenges.
【Copyright and Disclaimer】The above information is collected and organized by PlastMatch. The copyright belongs to the original author. This article is reprinted for the purpose of providing more information, and it does not imply that PlastMatch endorses the views expressed in the article or guarantees its accuracy. If there are any errors in the source attribution or if your legitimate rights have been infringed, please contact us, and we will promptly correct or remove the content. If other media, websites, or individuals use the aforementioned content, they must clearly indicate the original source and origin of the work and assume legal responsibility on their own.
Most Popular
-

AI Computing Power Demand Ignites Electronic Fabrics! China Jushi Hits Limit Up! Domestic Substitution Welcomes Golden Window
-

Focus on going global! kingfa sci. leads, huitong, preter, and kumho nire follow, china’s modified plastics frenziedly expanding worldwide
-

Back-to-back major joker moves! covestro’s 1.32 million ton mdi dual-line expansion and hdi acquisition reshape global polyurethane landscape
-

Evonik Parts Ways With The Polyester Business! A Strategic Retreat By A Germany Chemical Giant And The Global Industry Shift
-

PA66 Cost and Profit: Broad-Based Weakness in the Feedstock Market Continues to Erode Cost Support for PA66 (202606)


