


Shanying International has just divested, and Nordic Paper has achieved a record high in revenue, with net profit nearing historical peaks!
Recently, Norveg Paper officially published its annual report for 2024. The report shows that in 2024, the Norveg Paper Group's sales increased by 4% compared to 2023, reaching SEK 4.668 billion (approximately RMB 335 million), marking a historical high. The group's profit before interest, taxes, depreciation, and amortization increased by 4% year-on-year to SEK 806 million (approximately RMB 57.7 million), reaching the second-highest level ever, with a profit before interest, taxes, depreciation, and amortization rate of 17.3%. The growth in profit before interest, taxes, depreciation, and amortization was mainly due to increased sales volume and optimization of product structure.
The group achieved a net profit of 465 million Swedish kronor (approximately 332 million yuan), with a net profit margin close to 10%. In comparison, Shanying International expects its net profit attributable to shareholders of the listed company for the year 2024 to be between -350 million and -390 million yuan, indicating a loss compared to the same period last year. Additionally, the expected net profit attributable to shareholders of the listed company for 2024, after deducting non-recurring gains and losses, is estimated to be between -650 million and -750 million yuan.
As of now, Nordic Paper has a total of 698 employees across 5 factories, equipped with 9 paper machines. The company serves 730 clients, operating in 81 countries and regions worldwide. In terms of business divisions, the牛皮 Paper division comprises two paper factories: Bekkhamar Paper Mill (with 2 paper machines) and Amotfors Paper Mill (with 2 paper machines). The main revenue source for this division is bagboard paper, accounting for a share of up to 53%. The next largest segments are MG paper and other special papers, with shares of 23% and 24% respectively.
In 2024, the net sales of this business decreased by 2% year-on-year to 2.277 billion Swedish Krona (approximately 1.63 billion RMB), accounting for 48% of the group's net sales. The main reason for this decline was the decrease in product selling prices. Earnings before interest, taxes, depreciation, and amortization (EBITDA) fell by 34% year-on-year to 392 million Swedish Krona. The decline in EBITDA was also primarily due to falling product prices. The EBITDA margin decreased to 17.2%. Operating profit was 331 million Swedish Krona, with an operating profit margin of 14.5%. The majority of the sales revenue in the kraft paper division comes from the European market.
The business department of the natural paper business has set up three paper mills, each equipped with two paper machines, one at the Glaceau paper mill, one at the Quebec paper mill, and two at the Savelle paper mill. The main source of income for this business is the baking paper, with a share of 77%. The second source is the baking paper cup, with a share of 16%.
The net sales of the natural greaseproof paper business department reached 2.448 billion Swedish Krona (approximately 1.752 billion RMB), with a year-on-year growth of 12%, accounting for 52% of the group's net sales. The increase in sales volume and product mix optimization contributed to a 14% growth. Earnings before interest, taxes, depreciation, and amortization (EBITDA) grew by 58% year-on-year, reaching 446 million Swedish Krona. The EBITDA margin improved to 18.2%. Operating profit increased to 366 million Swedish Krona, and the operating profit margin also rose to 14.9%. The majority of sales revenue from the natural greaseproof products department comes from the European market, but North America is also an important market.
Overall, Nordic Paper demonstrated strong operational resilience in 2024. Despite facing challenges such as rising raw material costs, the company achieved double-digit growth in both sales and profits by optimizing its product mix, controlling energy and transportation costs, and strategically investing to improve production efficiency. Its premium market positioning, sustainable production capabilities, and global footprint, particularly the strong performance of its natural greaseproof paper business, laid the foundation for long-term competitiveness. In contrast, Shanying International found itself mired in losses in 2024, presenting a stark contrast to Nordic Paper's impressive performance.
In 2017, Eagle International acquired 100% of Norske Skog's shares for 2.4 billion Swedish kronor, formally entering the high-tech special paper market with high barriers to entry and stronger profitability. Through the establishment of SUTRIV Holding AB in Sweden, Eagle International indirectly holds 100% of Norske Skog's shares. This move is seen as an important step in the company's internationalization strategy.
According to the annual reports of ShanYing International for 2017-2019: In 2017, ShanYing International's net profit was 20.14 billion yuan, while Nordisk Papir's net profit was only 3.168 million yuan; in 2018, ShanYing International's net profit increased to 32.04 billion yuan, with Nordisk Papir's net profit rising to 1.75 billion yuan, accounting for 5.46% of ShanYing International's net profit; in 2019, ShanYing International's net profit was 13.62 billion yuan, with Nordisk Papir's net profit rising again to 2.05 billion yuan, accounting for 14.75% of ShanYing International's net profit.
In October 2020, Nordic paper company became the first Scandinavian company to list on the Nasdaq OMX Stockholm. Following its listing, the company's holding in SUTRIV Holding AB decreased to 48.16%. As a result, Nordic paper company no longer is part of SUTRIV Holding AB's financial report.
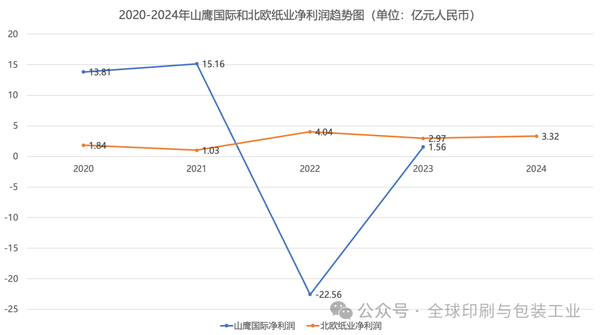
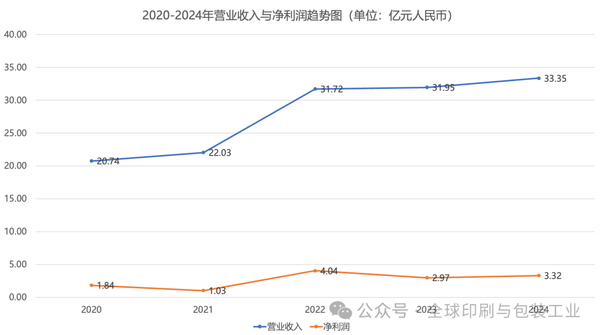
From the annual reports of Shanying International and Nordic Paper from 2020 to 2023, we can see the above chart. Except for the years 2020-2021, Nordic Paper's revenue and net profit have been significantly lower than that of Shanying International; however, since 2022, Shanying International's net profit has not been able to compare with Nordic Paper. In 2022, when Nordic Paper reached its peak net profit, Shanying International suffered a loss of 2.256 billion yuan. In 2024, when Nordic Paper's net profit reached its second-highest in history, Shanying International again faced severe losses.
In October 2024, following the announcement by global investment firm SVP that its newly established company, Coniferous BidCo, would launch a full takeover bid for Nordic Paper, a Swedish manufacturer of kraft paper and greaseproof paper, the largest shareholder of Nordic Paper, China-based Yangtze River Paper Industry, made an irrevocable commitment to accept SVP's offer. At that time, Yangtze River Paper Industry held 48.16% of Nordic Paper's shares (amounting to approximately 1.1 billion RMB), which was also the upper limit for shares set by SVP for this acquisition. On December 3, 2024, the European Commission approved the acquisition case, making SVP the majority shareholder of Nordic Paper.
By previously transferring the stake in Nordisk Paper, Shan Ying International may have temporarily alleviated its financial pressures, but it has given up a profitable, technologically advanced and high-end market core asset. With Nordisk Paper's ability to contribute over 30 million yuan in net profit in 2024, this starkly contrasts with Shan Ying's massive losses, highlighting the further weakening of its profit landscape after divesting its core assets. Meanwhile, Nordisk Paper strengthens its advantages in its niche area through continuous technological investment, whereas Shan Ying International, after divesting Nordisk, urgently needs to clarify new growth areas. Its current loss situation may compel a business structure optimization, but it may face transitional pains in the short term.
The losses of Shanying International and the growth trajectory of Nordic Paper essentially reflect two distinct paths for the transformation of traditional paper manufacturing companies: the former is hampered by cyclical fluctuations in the domestic industry and low value-added competition, while the latter achieves breakthroughs through technical barriers, global expansion, and high-end products. For Shanying International, the sale of the Nordic Paper equity, though a desperate measure for survival, also signifies the abandonment of a long-term value growth engine. In the future, the company needs to focus on cost reduction and efficiency improvement, optimize its product structure, and explore circular economy or emerging sectors.
【Copyright and Disclaimer】The above information is collected and organized by PlastMatch. The copyright belongs to the original author. This article is reprinted for the purpose of providing more information, and it does not imply that PlastMatch endorses the views expressed in the article or guarantees its accuracy. If there are any errors in the source attribution or if your legitimate rights have been infringed, please contact us, and we will promptly correct or remove the content. If other media, websites, or individuals use the aforementioned content, they must clearly indicate the original source and origin of the work and assume legal responsibility on their own.
Most Popular
-

AI Computing Power Demand Ignites Electronic Fabrics! China Jushi Hits Limit Up! Domestic Substitution Welcomes Golden Window
-

Focus on going global! kingfa sci. leads, huitong, preter, and kumho nire follow, china’s modified plastics frenziedly expanding worldwide
-

PA66 Cost and Profit: Broad-Based Weakness in the Feedstock Market Continues to Erode Cost Support for PA66 (202606)
-

Back-to-back major joker moves! covestro’s 1.32 million ton mdi dual-line expansion and hdi acquisition reshape global polyurethane landscape
-

Evonik Parts Ways With The Polyester Business! A Strategic Retreat By A Germany Chemical Giant And The Global Industry Shift


