


[PBT Weekly Review] Cost Support Weakens, Spot Prices Continue to Decline
1. Market Review of the Week: Cost support weakened, and PBT spot prices declined.
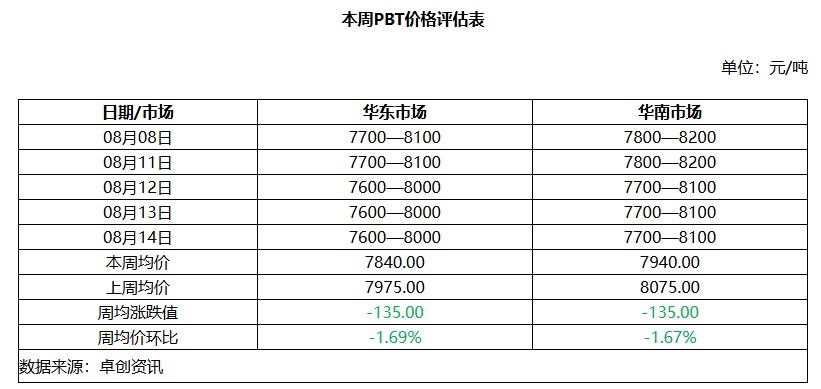
This week, the BDO and PTA markets continue to decline, leading to a decrease in cost support for PBT. Additionally, the demand for PBT has remained consistently weak recently, resulting in a drop in spot prices for PBT during the week. As of August 14, the mainstream transaction range for 1.0 viscosity pure resin PBT in the East China market is between 7600-8000 yuan/ton, with the weekly average price at 7840 yuan/ton, a decrease of 1.69% compared to the previous week's average price.
2. Analysis of driving factors: weakening cost support and declining market prices.
From the raw materials perspective, the BDO August contract period is coming to an end, with fewer new negotiations and prices gradually bottoming out. Additionally, crude oil is fluctuating downward and PTA spot supply is abundant, leading to a decrease in the weekly average price of PTA. Overall, PBT costs continue to decline. From a fundamental standpoint, a 60,000-ton PBT plant in East China restarted this week, and a new 60,000-ton capacity in the Southwest has produced quality products (not yet priced), which will be included in the total capacity next month. The spot supply is ample within the week, and some factories have continued to lower their quotations, resulting in a decline in PBT prices during the week.
BDO:This week, negotiations in the BDO market gradually slowed down as the August contract cycle drew to a close, leading to fewer new negotiations and prices gradually bottoming out. As of the close on August 14th, the weekly average price of East China bulk liquid sources was 7,710 yuan/ton, a decrease of 260 yuan/ton compared to the previous period. On Thursday, the East China BDO bulk liquid market price was 7,600-7,700 yuan/ton, with the lower-end price down by 200 yuan/ton and the upper-end price down by 200 yuan/ton compared to the previous closing. The BDO market stabilized after the decline this week, with participants mainly fulfilling previous contracts, leading to a muted spot negotiation atmosphere and the market entering a wait-and-see period. On the supply side, the restart of new installations was delayed, while the Black Cat installation restarted, and some installations signaled production cuts. On the demand side, the operating load of downstream PTMEG and GBL industries slightly increased, leading to slightly higher consumption than before, but customer enthusiasm for market restocking remains low. Most traders are limited in their operations, waiting for new cycle guidance, with some final orders heard to be sold at slightly lower negotiated prices.
PTA:The average weekly price of PTA declined this week, mainly due to fluctuating and falling crude oil prices and ample PTA spot supply. Expectations of negotiations between the United States and a certain European country remain bearish for crude oil prices, with Brent crude oil prices once falling to around $65 per barrel, weakening the cost support for PTA. The PTA supply and demand situation is relatively stable, with sufficient PTA supply. All startups and shutdowns of units are planned, and there are no unplanned PTA unit shutdowns. Additionally, no official trial operation news has been announced for another 1.6 million tons of new PTA units in East China. Spot offers and bids spreads have gradually weakened. Downstream rigid demand remains stable, with polyester operating rates fluctuating around 87%. This week, the average weekly price of PTA was 4,684.20 yuan/ton, down 0.29% from the previous period.
3. Outlook for Next Week: With weakening cost support combined with weak demand, PBT spot prices are likely to fluctuate weakly.
Next week, the PBT market price is expected to fluctuate weakly. From the cost side, the market lacks new substantial positive drivers; PTA supply is ample, and PTA prices are anticipated to decline slightly next week. Additionally, during the BDO contract delivery period, market participants remain cautious, waiting for policy clarity, leading to weak and consolidated prices. Overall, the PBT cost side is weak. On the supply side, there are no plans for changes in production units; attention is on whether some PBT units will restart. PBT capacity utilization rates are expected to remain stable next week. From the demand side, downstream orders are being placed slowly, and PBT demand may continue to be sluggish. With costs declining and supply ample, the short-term PBT market is likely to fluctuate weakly, with the mainstream transaction price reference range at 7,500–8,000 RMB/ton.
【Copyright and Disclaimer】The above information is collected and organized by PlastMatch. The copyright belongs to the original author. This article is reprinted for the purpose of providing more information, and it does not imply that PlastMatch endorses the views expressed in the article or guarantees its accuracy. If there are any errors in the source attribution or if your legitimate rights have been infringed, please contact us, and we will promptly correct or remove the content. If other media, websites, or individuals use the aforementioned content, they must clearly indicate the original source and origin of the work and assume legal responsibility on their own.
Most Popular
-

AI Computing Power Demand Ignites Electronic Fabrics! China Jushi Hits Limit Up! Domestic Substitution Welcomes Golden Window
-

Focus on going global! kingfa sci. leads, huitong, preter, and kumho nire follow, china’s modified plastics frenziedly expanding worldwide
-

Back-to-back major joker moves! covestro’s 1.32 million ton mdi dual-line expansion and hdi acquisition reshape global polyurethane landscape
-

Evonik Parts Ways With The Polyester Business! A Strategic Retreat By A Germany Chemical Giant And The Global Industry Shift
-

PA66 Cost and Profit: Broad-Based Weakness in the Feedstock Market Continues to Erode Cost Support for PA66 (202606)


