


Over 50% of Car Dealers Posted Losses in First Half of Year, Only 30% Met Sales Targets
New car sales continue to face pressure, and the proportion of loss-making automobile dealers has expanded. Recently, the China Automobile Dealers Association released a report on the survival status of automobile dealers nationwide for the first half of 2025, which shows that in the first half of the year, the proportion of loss-making dealers rose to 52.6%, the proportion breaking even was 17.5%, and the proportion making a profit was 29.9%.
Dealers of independent new energy vehicle (NEV) brands are performing better than those of traditional fuel vehicle brands. The profit and loss situation for independent NEV brand dealers is as follows: 42.9% are profitable, 22.7% are breaking even, and 34.4% are operating at a loss. In contrast, for traditional fuel vehicle brand dealers, 25.6% are profitable, 15.8% are breaking even, and 58.6% are operating at a loss.
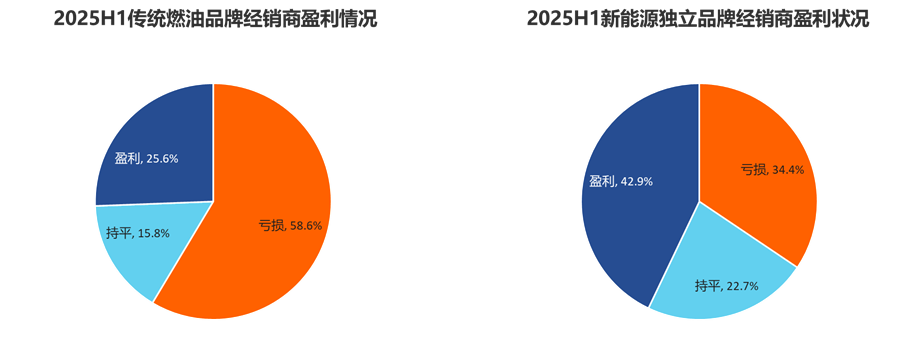 Image source: China Automobile Dealers Association
The survey also showed that in the first half of the year, only 30.3% of dealers achieved their sales targets. Dealers with a target completion rate below 70% accounted for 29.0%, while those with a target completion rate above 70% but below 100% accounted for 40.7%.
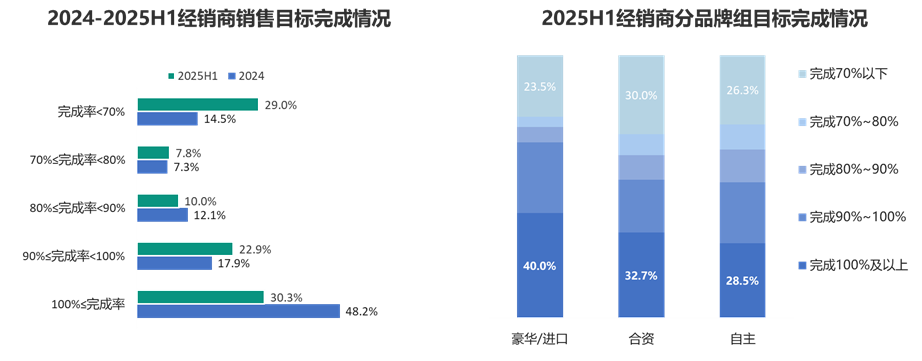 Image source: China Automobile Dealers Association
From the perspective of brand groups, luxury brands have a slightly better target completion rate compared to joint venture brands and independent brands. Among joint venture brands, the proportion of dealers who completed 70% or less of their targets is higher than that of luxury/import brands and independent brands.
The survey shows that in the first half of the year, 74.4% of car dealers experienced varying degrees of price inversion, and 43.6% of car dealers had a price inversion of more than 15%.
The China Automobile Dealers Association analyzed that severe price inversion has eroded dealers’ cash flow, resulting in widespread reports of financial pressure among dealers. In particular, dealers of traditional fuel vehicle brands are suffering significant losses in their new car business due to price inversion. Independent new energy vehicle brand dealers mainly face pressures such as low after-sales output value and long investment payback periods.
Looking ahead to 2025, dealers' overall outlook is for slight growth or stability, but their expectations for growth are lower than those at the end of last year. Approximately 49% of dealers believe that annual sales will increase, while the proportion of dealers expecting a decline has slightly risen compared to 2024.
The nationwide survey on the survival status of car dealers was officially launched in July 2025. After more than a month of collecting questionnaires, the survey covered 4S stores under large and medium-sized car dealer groups, as well as small groups and single stores, with a total of 936 valid questionnaires recovered.
The survey results show that the overall satisfaction score of car dealers is 64.7 points, which has significantly decreased compared to the end of 2024. The core issues are the increasing price inversion and intensified financial pressures, among other compounded operational pressures. Additionally, dealers reported that the rewards from manufacturers for achieving basic targets have shrunk, leading to a severe imbalance between effort and reward. Therefore, dealers' satisfaction with the manufacturers has significantly declined.
In early July this year, the four major associations of the Yangtze River Delta jointly issued a "Letter Requesting Automakers to Improve the Operating Difficulties of Automobile Dealers in the Yangtze River Delta Region," which mentioned that automobile dealerships in the Yangtze River Delta are generally facing severe challenges such as high inventory levels, disorderly market competition, and an increased risk of corporate capital chain rupture.
【Copyright and Disclaimer】The above information is collected and organized by PlastMatch. The copyright belongs to the original author. This article is reprinted for the purpose of providing more information, and it does not imply that PlastMatch endorses the views expressed in the article or guarantees its accuracy. If there are any errors in the source attribution or if your legitimate rights have been infringed, please contact us, and we will promptly correct or remove the content. If other media, websites, or individuals use the aforementioned content, they must clearly indicate the original source and origin of the work and assume legal responsibility on their own.
Most Popular
-

AI Computing Power Demand Ignites Electronic Fabrics! China Jushi Hits Limit Up! Domestic Substitution Welcomes Golden Window
-

Focus on going global! kingfa sci. leads, huitong, preter, and kumho nire follow, china’s modified plastics frenziedly expanding worldwide
-

Back-to-back major joker moves! covestro’s 1.32 million ton mdi dual-line expansion and hdi acquisition reshape global polyurethane landscape
-

PA66 Cost and Profit: Broad-Based Weakness in the Feedstock Market Continues to Erode Cost Support for PA66 (202606)
-

Evonik Parts Ways With The Polyester Business! A Strategic Retreat By A Germany Chemical Giant And The Global Industry Shift


