


Oil Long-Short Game Intensifies: Supply and Demand Tug-of-War in a Volatile Market
In mid-August, WTI crude oil and Brent crude oil temporarily stabilized at $63.96 per barrel and $66.63 per barrel, respectively, having retreated over 10% from their annual highs. The current trend in oil prices is being hit by the dual pressures of expanding supply and concerns over demand. Coupled with geopolitical uncertainties, the risk of market volatility has significantly increased.
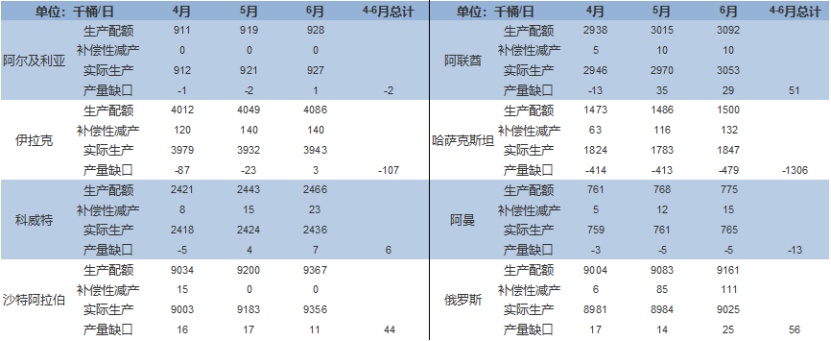
1. Supply Side: Coexistence of Increased Production and Geopolitical Risks
OPEC+'s shift in production policy has become a key factor in suppressing oil prices. The decision reached at the beginning of August to increase production by 548,000 barrels per day in September marks the full exit from the organization's 2.2 million barrels per day reduction agreement.(The image below)。The cumulative increase in production from April to August has reached 1.919 million barrels per day, equivalent to 2% of global daily demand. More noteworthy is that another voluntary production cut agreement of 1.66 million barrels per day will be reassessed by the end of December, and the pressure on the supply side may continue to intensify.
In terms of geopolitics,The August 15th US-Russia summit has become the focus of the market. If an agreement is reached to lift sanctions on Russian oil, it could release about 2 million barrels per day of potential supply. However, Iran's tough stance on the "US corridor" in the Caucasus, as well as Ukraine's attacks on Russian refineries, continue to create supply disruptions. The US's pressure policies on oil-producing countries are also showing effects, with the discount on Russian Urals crude oil widening to $5 per barrel, and Indian state-owned refineries considering suspending imports of Russian oil. Chinese major refineries have begun negotiating purchases of Urals crude, which may reshape global trade flows.
2. Demand Side: End of Peak Season and Macroeconomic Pressures
Current oil consumption showsThe characteristic of "strong reality, weak expectation." The U.S. refinery operating rate is as high as 96.9%, but historical patterns indicate that it will peak and decline after late August. High-frequency data shows that gasoline demand decreased by 2.7% month-on-month, while distillate demand increased by 1.9%, reflecting that the driving force of the summer travel peak season is weakening.
Macro-level pressure is emerging. United StatesNonfarm payrolls increased by only 152,000 in July, and CME interest rate futures show that the market is pricing in a 90.7% probability of a rate cut in September. While easing expectations provide short-term support for risk assets, an economic slowdown will ultimately suppress demand. Risks remain in the trade sector, as Trump’s threat of a 35% tariff on EU automobiles could impact global trade volumes.
Institutional forecasts show significant divergence.OPEC raised its 2026 demand forecast by 100,000 barrels per day, while the EIA raised its 2025/26 supply forecasts by 800,000 and 700,000 barrels per day, respectively, and lowered its 2026 Brent average price forecast to $51.43 per barrel.
3. Price Path Projection: Short-term Fluctuations and Long-term Variables
Changes in futures market positions confirm the waning bullish sentiment.The non-commercial net long positions in WTI have decreased by 22.57% compared to the July average, while the net long positions in Brent funds have decreased by 19,559 contracts week-on-week. Technically, the range of $62.5-$65.5 per barrel constitutes the short-term fluctuation zone for WTI, with an options barrier support at the $60 level, and a large number of producer hedging sell orders concentrated in the $68-$70 area.
The market focus for the next two weeks is clearly directed toward three catalysts.
The outcome of the US-Russia talks(August 15): If a ceasefire framework is reached, oil prices may test the psychological level of $60; if negotiations break down, geopolitical premiums could drive a rebound above $68.
EIA Inventory Evolution: Current U.S. commercial inventories are at a five-year average low, but the latest API data shows an unexpected crude oil build of 1.519 million barrels. If the build trend continues into the peak season, it will strengthen the bearish outlook.
Federal Reserve Policy Signals:The CPI data for July has alleviated inflation concerns, but if the Jackson Hole meeting in August sends hawkish signals, it may suppress oil prices through the dollar channel.
In the medium to long term, three major variables will determine the trajectory of oil prices.
Supply side:The direction of adjustments to voluntary production cuts at the OPEC+ December meeting, as well as the actual enforcement strength of US sanctions on Russian oil.
Demand Side: Heating demand performance in the Northern Hemisphere winter and changes in operating rates of Chinese refineries.
Policy aspect: Adjustments in energy policy before and after the U.S. elections, particularly the potential easing of sanctions on Iran and Venezuela.
Author: Expert in Market Research from Specialty Plastics VisionZhao Hongyan

【Copyright and Disclaimer】This article is the property of PlastMatch. For business cooperation, media interviews, article reprints, or suggestions, please call the PlastMatch customer service hotline at +86-18030158354 or via email at service@zhuansushijie.com. The information and data provided by PlastMatch are for reference only and do not constitute direct advice for client decision-making. Any decisions made by clients based on such information and data, and all resulting direct or indirect losses and legal consequences, shall be borne by the clients themselves and are unrelated to PlastMatch. Unauthorized reprinting is strictly prohibited.
Most Popular
-

AI Computing Power Demand Ignites Electronic Fabrics! China Jushi Hits Limit Up! Domestic Substitution Welcomes Golden Window
-

Focus on going global! kingfa sci. leads, huitong, preter, and kumho nire follow, china’s modified plastics frenziedly expanding worldwide
-

PA66 Cost and Profit: Broad-Based Weakness in the Feedstock Market Continues to Erode Cost Support for PA66 (202606)
-

Back-to-back major joker moves! covestro’s 1.32 million ton mdi dual-line expansion and hdi acquisition reshape global polyurethane landscape
-

Evonik Parts Ways With The Polyester Business! A Strategic Retreat By A Germany Chemical Giant And The Global Industry Shift


