


National Bureau of Statistics: Profits of Industrial Enterprises Above Designated Size Nationwide Declined 1.8% in January-June 2025
According to the website of the National Bureau of Statistics, from January to June, industrial enterprises above a designated size nationwide achieved a total profit of 3,436.5 billion yuan, a year-on-year decrease of 1.8% (calculated on a comparable basis). Among them, the rubber and plastic products industry achieved a total profit of 72.49 billion yuan, a year-on-year decrease of 2.8%.
From January to June, among industrial enterprises above the designated size, state-holding enterprises achieved a total profit of 1,109.12 billion yuan, down 7.6% year-on-year; joint-stock enterprises achieved a total profit of 2,533.04 billion yuan, down 3.1%; enterprises funded by foreign investors and investors from Hong Kong, Macao and Taiwan achieved a total profit of 882.31 billion yuan, up 2.5%; and private enterprises achieved a total profit of 938.97 billion yuan, up 1.7%.
From January to June, the mining industry achieved a total profit of 429.41 billion yuan, a year-on-year decrease of 30.3%; the manufacturing industry achieved a total profit of 2,590.06 billion yuan, an increase of 4.5%; and the electricity, heat, gas, and water production and supply industry achieved a total profit of 417.04 billion yuan, an increase of 3.3%.
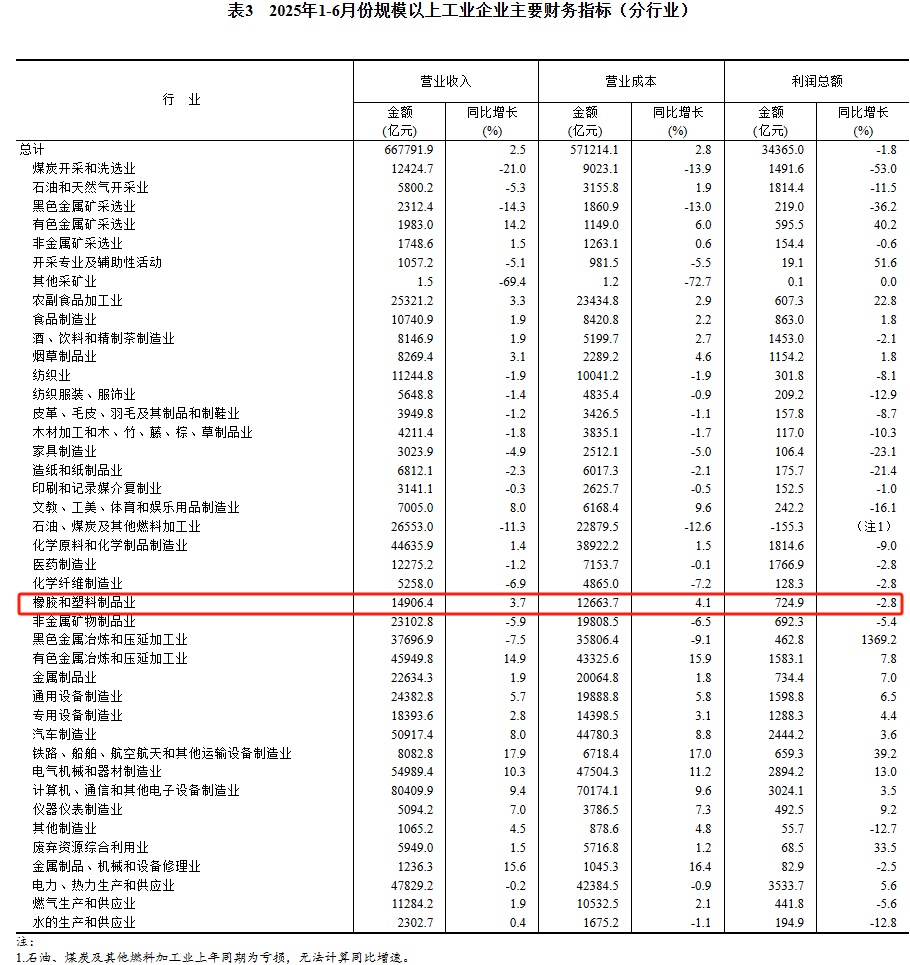
From January to June, the profit performance of major industries was as follows: profits in the ferrous metal smelting and rolling processing industry increased by 13.7 times year-on-year; the agricultural and sideline food processing industry grew by 22.8%; the electrical machinery and equipment manufacturing industry grew by 13.0%; the non-ferrous metal smelting and rolling processing industry grew by 7.8%; the general equipment manufacturing industry grew by 6.5%; the production and supply of electricity and heat industry grew by 5.6%; the specialized equipment manufacturing industry grew by 4.4%; the automobile manufacturing industry grew by 3.6%; the computer, communication, and other electronic equipment manufacturing industry grew by 3.5%. In contrast, profits in the non-metallic mineral products industry fell by 5.4%, the textile industry declined by 8.1%, the chemical raw materials and chemical products manufacturing industry decreased by 9.0%, the oil and natural gas extraction industry dropped by 11.5%, the coal mining and washing industry decreased by 53.0%, and the oil, coal, and other fuel processing industries reported increased losses compared to the same period last year.
From January to June, industrial enterprises above the designated size achieved operating revenue of 66.78 trillion yuan, marking a year-on-year increase of 2.5%. The operating costs amounted to 57.12 trillion yuan, up by 2.8%. The operating revenue profit margin was 5.15%, a decrease of 0.22 percentage points compared to the same period last year.
At the end of June, the total assets of industrial enterprises above the designated size amounted to 183.17 trillion yuan, an increase of 5.1% year-on-year; total liabilities were 105.98 trillion yuan, growing by 5.4%; total owner's equity was 77.19 trillion yuan, an increase of 4.7%. The asset-liability ratio was 57.9%, up by 0.2 percentage points year-on-year.
At the end of June, accounts receivable of industrial enterprises above designated size amounted to 26.69 trillion yuan, a year-on-year increase of 7.8%; finished goods inventory was 6.60 trillion yuan, an increase of 3.1%.
From January to June, the cost per 100 yuan of operating revenue for industrial enterprises above designated size was 85.54 yuan, an increase of 0.26 yuan year-on-year; the expenses per 100 yuan of operating revenue were 8.38 yuan, a decrease of 0.10 yuan year-on-year.
At the end of June, large-scale industrial enterprises generated operating income of 73.9 yuan per 100 yuan of assets, a year-on-year decrease of 1.9 yuan; per capita operating income was 1.823 million yuan, a year-on-year increase of 56,000 yuan; finished goods inventory turnover days were 20.4 days, a year-on-year increase of 0.1 days; and the average accounts receivable collection period was 69.8 days, a year-on-year increase of 3.9 days.
In June, the profits of industrial enterprises above the designated size decreased by 4.3% year-on-year, narrowing compared to May.
Appendix: Interpretation of Data from the National Bureau of Statistics
Yu Weining, Statistician of the Industrial Department of the National Bureau of Statistics, explains.Industrial Enterprise Profit Data for June 2025:
In June, the year-on-year decline in profits of industrial enterprises above designated size narrowed compared to May, with the profit growth of new momentum industries represented by the equipment industry being relatively fast. The effectiveness of enterprises showed the following characteristics:
Revenue continues to grow, and the decline in corporate profits has narrowed.In June, the operating revenue of industrial enterprises above designated size increased by 1.0% year-on-year, maintaining the same growth rate as in May. The continuous growth in industrial enterprises' revenue creates favorable conditions for the recovery of corporate profits. In June, these enterprises achieved a total profit of 715.58 billion yuan, a year-on-year decrease of 4.3%, with the decline narrowing by 4.8 percentage points compared to May. Notably, the manufacturing sector showed significant improvement, with profits shifting from a 4.1% decline in May to a growth of 1.4%. Cumulatively, from January to June, the operating revenue of industrial enterprises above designated size grew by 2.5%, while profits decreased by 1.8%.
The revenue and profit of the equipment manufacturing industry have grown rapidly, playing a prominent supporting role.In June, the operating income of the equipment manufacturing industry increased by 7.0% year-on-year, accelerating by 0.3 percentage points compared to May; profits turned from a 2.9% decline in May to an increase of 9.6%, driving the profit growth of all large-scale industries by 3.8 percentage points, highlighting its significant support for the profits of large-scale industries. Among the eight sectors in the equipment manufacturing industry, four sectors achieved profit growth. Among them, the automotive industry saw a profit growth of 96.8% due to factors such as rapid sales growth driven by promotional activities from car companies and increased investment returns from key enterprises. The profits of the electrical machinery, instrumentation, and metal products sectors grew by 18.7%, 12.3%, and 6.2%, respectively.
The high-end, intelligent, and green development of the manufacturing industry is being further advanced.In June, profits in industries related to the high-end, intelligent, and green development of manufacturing grew rapidly, providing stable support for high-quality industrial development. Among them, in the high-end equipment manufacturing sector, profits in industries such as electronic special materials manufacturing, aircraft manufacturing, and marine engineering equipment manufacturing increased by 68.1%, 19.0%, and 17.8% year-on-year, respectively; accelerated production of intelligent and automated products drove profit growth in related industries, with profits in smart consumer device manufacturing and drawing, computing, and measuring instrument manufacturing rising by 40.9% and 12.5%, respectively; the accelerated formation of green production and green lifestyles promoted positive profit growth in related industries, with profits in lithium-ion battery manufacturing, biomass power generation, and environmental monitoring specialized instrument manufacturing increasing by 72.8%, 24.5%, and 22.2%, respectively.
The effect of the "Two New" policies continues to be evident.Since the beginning of this year, the categories and scope of subsidies supported by the "Two New" policies have continued to expand, leading to a significant improvement in profits across related industries. Driven by large-scale equipment renewal policies, profits in June for industries such as medical instruments and equipment manufacturing, specialized equipment manufacturing for printing, pharmaceuticals, daily chemicals and daily necessities production, and general parts manufacturing grew rapidly, rising by 12.1%, 10.5%, and 9.5% year-on-year, respectively. The trade-in policies for consumer products such as electronics, home appliances, and kitchen and bathroom products have continued to yield results. In June, profits for industries such as smart unmanned aerial vehicle manufacturing, computer complete unit manufacturing, household air conditioner manufacturing, and household ventilation appliance manufacturing increased by 160.0%, 97.2%, 21.0%, and 9.7% respectively; profits in related sectors along the industry chain, such as optoelectronic device manufacturing and computer component manufacturing, rose by 29.6% and 16.9% respectively.
In the next phase, in the face of a complex and volatile external environment, we must resolutely implement the decisions and deployments of the Party Central Committee, advance the development of a unified national market, expand and strengthen the domestic economic cycle, unwaveringly promote the high-quality development of the industrial economy, and continuously consolidate the foundation for the recovery of industrial enterprises' benefits.
【Copyright and Disclaimer】The above information is collected and organized by PlastMatch. The copyright belongs to the original author. This article is reprinted for the purpose of providing more information, and it does not imply that PlastMatch endorses the views expressed in the article or guarantees its accuracy. If there are any errors in the source attribution or if your legitimate rights have been infringed, please contact us, and we will promptly correct or remove the content. If other media, websites, or individuals use the aforementioned content, they must clearly indicate the original source and origin of the work and assume legal responsibility on their own.
Most Popular
-

AI Computing Power Demand Ignites Electronic Fabrics! China Jushi Hits Limit Up! Domestic Substitution Welcomes Golden Window
-

Focus on going global! kingfa sci. leads, huitong, preter, and kumho nire follow, china’s modified plastics frenziedly expanding worldwide
-

PA66 Cost and Profit: Broad-Based Weakness in the Feedstock Market Continues to Erode Cost Support for PA66 (202606)
-

Back-to-back major joker moves! covestro’s 1.32 million ton mdi dual-line expansion and hdi acquisition reshape global polyurethane landscape
-

Evonik Parts Ways With The Polyester Business! A Strategic Retreat By A Germany Chemical Giant And The Global Industry Shift


