


MDI Giants Unite in Price Support! How Will the Market React to Tariff Escalations?
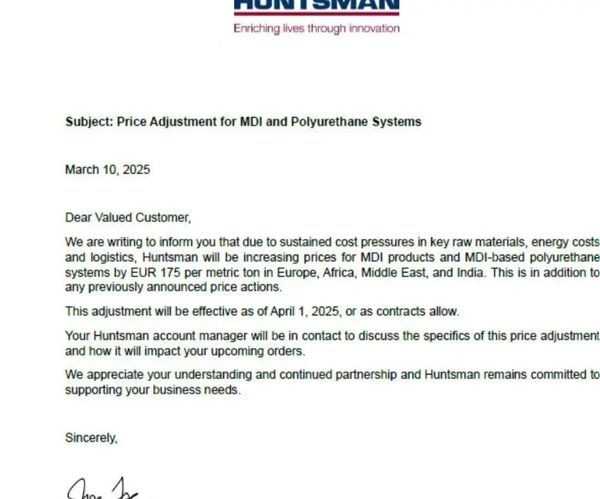
Recently, Huntsman Corporation announced that due to ongoing cost pressures from key raw materials, energy costs, and logistics, Huntsman will increase the price of MDI products and MDI-based polyurethane systems by 175 euros per ton in Europe, Africa, the Middle East, and India. This adjustment will take effect on April 1, 2025, or as permitted by contract.
Huntsman's current price adjustment is its second round of price increases following a 125 euros/ton increase on February 1st. Meanwhile, giants such as Wanhua Chemical, BorsodChem, Dow Chemical, BASF, and Kumho of South Korea have also密集上调MDI价格,涨幅在100-300美元/吨不等。在涨价的原因中,这些公司都提到了表示是由于物流、原材料和能源成本不断上涨。 densely raised MDI prices in the first quarter, with increases ranging from 100 to 300 US dollars per ton. In the reasons for the price hikes, these companies all mentioned that it was due to the continuous rise in logistics, raw materials, and energy costs.
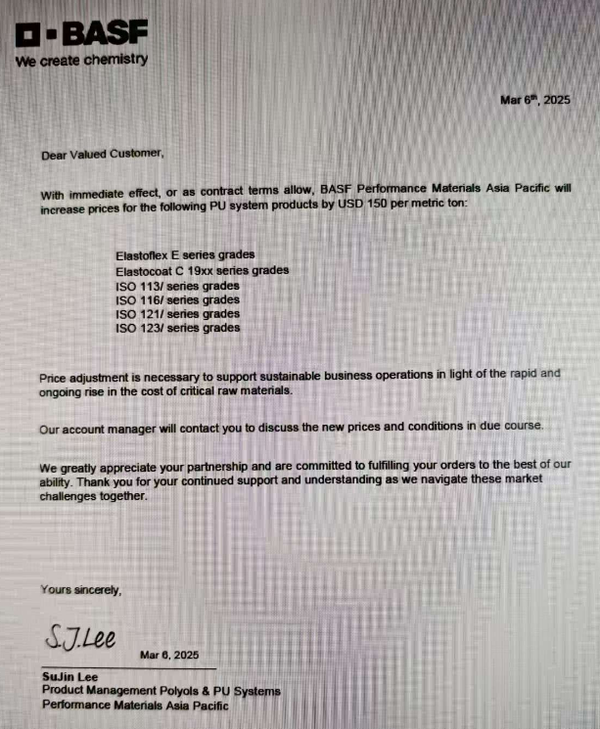
On March 6, BASF's Performance Materials division in the Asia Pacific region announced that, effective immediately or as permitted by contract terms, the prices of the following polyurethane system products will be increased by $150 per ton: Elastoflex E series grades, Elastocoat C 19xx series grades, ISO 113/ series grades, ISO 116/ series grades, ISO 121/ series grades, ISO 123/ series grades. The reason cited is the sustained and rapid increase in the price of key raw materials.
In addition, it is worth mentioning that in February, Dow and BASF formed an MDI fair trade alliance, requesting the U.S. Department of Commerce and the U.S. International Trade Commission to impose anti-dumping duties on MDI imported from China. In 2024, the U.S. tariff on polymeric MDI from China is 31.5%, and at the beginning of 2025, an additional 10% tariff will be imposed on goods exported from our country to the United States. Currently, the export of MDI from our country to the United States faces a high tariff of 41.5%.
Overall, the reasons for price increases given by various parties point to the rise in raw materials, energy, and logistics costs. Industry-leading companies are collectively adjusting prices to pass on cost pressures and maintain profit margins.
cost pressure
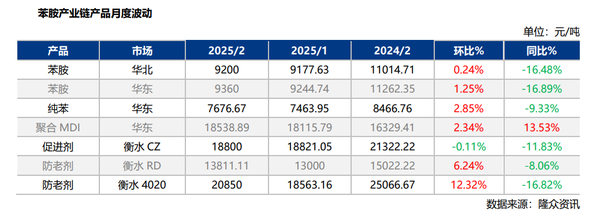
The upstream of the MDI industry chain includes raw materials such as aniline, formaldehyde, liquid chlorine, and carbon monoxide. Among these, the prices of basic chemical products like benzene and methanol are influenced by fluctuations in crude oil prices (with European and American crude oil futures rising to over 80 USD per barrel in early January), which have pushed up costs. The average price of pure benzene in February was 7676.67 CNY/ton, a month-on-month increase of 2.85%. According to Longzhong Information, the prices of key intermediate products in the aniline industry chain were generally higher in February compared to January, leading to an increase in MDI production costs.
supply tightness
In addition, recent停车检修of some MDI facilities in the Asian region has led to a tighter supply expectation, which is also one of the factors affecting this round of price increases in the industry. For example, TOSOH's 400,000 tons/year facility in Japan temporarily shut down on January 17 due to an incident and suspended quotations; KUMHO's 410,000 tons/year facility in South Korea plans to undergo maintenance for one month starting from early February (another 200,000 tons/year facility is operating normally); BASF's MDI facility in South Korea plans to undergo maintenance for about one month starting from February 9; Covestro's 70,000 tons/year facility in Japan will undergo a planned maintenance for one month starting in March.
high industry concentration
MDI supply is highly concentrated, making it easy for companies to form a united front in maintaining prices, which may further support the price maintenance logic and promote profit improvement. Major producers include Wanhua Chemical (3.5 million tons/year), BASF (2.07 million tons/year), Covestro (1.77 million tons/year), Huntsman (1.37 million tons/year), Dow (1.11 million tons/year), Mitsui Chemicals (610,000 tons/year), Tosoh Corporation (470,000 tons/year), and Iran's Karoon (40,000 tons/year). At the same time, inventories of some products are currently at low levels. Looking at a longer timeframe, there will be limited new global MDI capacity additions over the next three years, mainly including 600,000 tons from Wanhua in Ningbo (2025) and 200,000 tons from BASF in the US (2026).
downstream application demand
From the perspective of downstream application demand, changes in market demand are the underlying reason for this MDI price increase. In 2024, the recovery of the European construction industry is slow, and the growth in demand for automobiles and home appliances is limited, leading to lower-than-expected MDI consumption growth. In the Asia-Pacific region, especially in the Chinese market, the expansion of new energy and photovoltaic industries drives demand, but fierce price competition further squeezes manufacturers' profits.
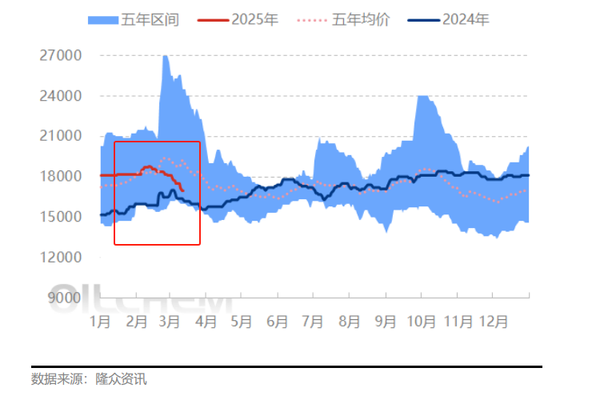
The actual market situation, as seen from the latest prices by Longzhong Information, shows that since February, after a slight increase, the market price of polymeric MDI has shown a downward trend, with transactions remaining moderate. As shown in the figure below, the actual transaction and offer prices for domestic Shanghai goods (44V20, M20S, 5005) are 16,900-17,300 yuan/ton, the actual transaction prices for domestic goods (PM200) are 17,400-17,600 yuan/ton, and the offer prices for imported goods (MR200, M200) are 16,800-17,300 yuan/ton.
Aggregated MDI price trend chart (yuan/ton)
However, companies like Huntsman are trying to reverse this situation and maintain operational stability by raising prices. Therefore, some industry experts believe that price hikes are not only a transfer of costs but also a prediction of future demand recovery—it is expected that the global economy will see a moderate recovery in 2025, with MDI demand potentially growing by 5%-6%. Additionally, when releasing its 2024 financial report, Huntsman stated that it expects to see more positive signs in the MDI industry in 2025, especially in the North American and Chinese markets.
In addition, on January 5th of this year, the National Development and Reform Commission and the Ministry of Finance issued the "Notice on Expanding the Implementation of Large-Scale Equipment Renewal and Consumer Goods Trade-in Policies by 2025", proposing to increase support for the trade-in of home appliances, actively support the renewal of home decoration consumer goods, and improve the subsidy standards for car replacement and updating. With the help of these policies, it is expected that the prosperity of polymeric MDI will continue. This is because in the home appliance and automotive industries, MDI accounts for about 15%-20% of the cost of refrigerators and car interiors.
【Copyright and Disclaimer】The above information is collected and organized by PlastMatch. The copyright belongs to the original author. This article is reprinted for the purpose of providing more information, and it does not imply that PlastMatch endorses the views expressed in the article or guarantees its accuracy. If there are any errors in the source attribution or if your legitimate rights have been infringed, please contact us, and we will promptly correct or remove the content. If other media, websites, or individuals use the aforementioned content, they must clearly indicate the original source and origin of the work and assume legal responsibility on their own.
Most Popular
-

AI Computing Power Demand Ignites Electronic Fabrics! China Jushi Hits Limit Up! Domestic Substitution Welcomes Golden Window
-

Focus on going global! kingfa sci. leads, huitong, preter, and kumho nire follow, china’s modified plastics frenziedly expanding worldwide
-

PA66 Cost and Profit: Broad-Based Weakness in the Feedstock Market Continues to Erode Cost Support for PA66 (202606)
-

Back-to-back major joker moves! covestro’s 1.32 million ton mdi dual-line expansion and hdi acquisition reshape global polyurethane landscape
-

Evonik Parts Ways With The Polyester Business! A Strategic Retreat By A Germany Chemical Giant And The Global Industry Shift


