


LYB Reports Q2 2025 Earnings with Revenue of $7.66 Billion
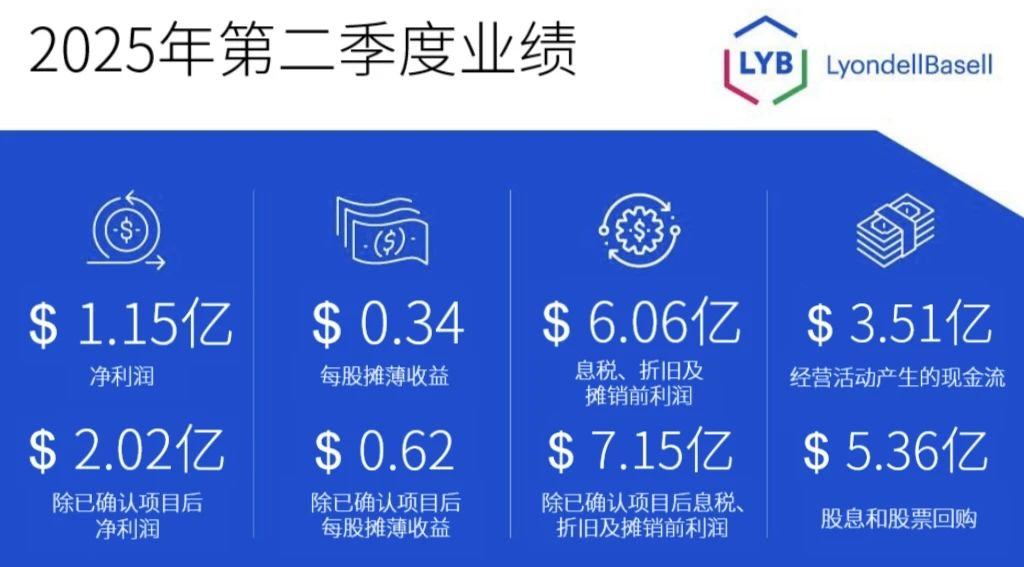
■ Net profit: USD 115 million; USD 202 million (excluding recognized projects)
■ Diluted earnings per share: $0.34 per share; $0.62 per share (excluding recognized items) ■ Earnings before interest, taxes, depreciation, and amortization (EBITDA): $606 million; $715 million (excluding recognized items)
■ Cash flow generated from operating activities: 351 million USD
■ Returned $536 million to shareholders through dividends and share repurchases
■ While executing the strategy, continue to address cyclical changes with operational and financial discipline.
Announced plans to sell part of European assets to further optimize the business portfolio.
Postpone the construction of the Flex-2 project to preserve capital during the downturn.
The cash improvement plan is progressing well, with an expected enhancement of $600 million annually by 2025, and further expansion in 2026 with an incremental target of $500 million.
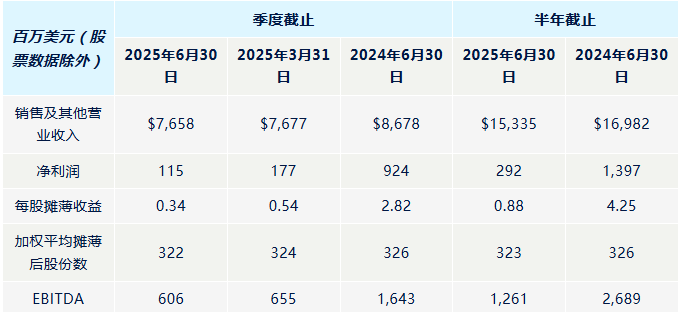
LYB (LyondellBasell) released its financial report for the second quarter of 2025. Comparative data with the previous quarter and the same period in 2024 are shown in the table below:
2025 Q2 Performance
In the second quarter of 2025, LYB achieved a net profit of $115 million, or diluted earnings per share of $0.34. During the quarter, the company recognized after-tax identified items totaling $87 million, which impacted second quarter earnings per share by $0.28. These items included asset impairments, transaction costs, cash improvement initiatives, and discontinued operations. EBITDA for the second quarter of 2025 was $606 million, or $715 million excluding identified items.
In North America, LYB successfully completed the turnaround of its Channelview complex, thereby improving operational efficiency and driving sequential improvements in integrated polyethylene production and profits. Domestic demand for polyethylene and polypropylene has shown seasonal growth, mainly due to strong demand in consumer packaging, healthcare, construction, and infrastructure markets. The increase in polyethylene contract prices in June has provided strong support for third-quarter profitability. In Europe, lower feedstock costs have helped improve integrated polyethylene margins, while sales of polyolefins have also benefited from increased seasonal demand.
The profitability of the intermediate chemicals business improved, mainly due to the decline in benzene costs and price support resulting from industry shutdowns in the second quarter, which boosted styrene margins. The typical seasonal increase during the summer driving season was limited by falling crude oil prices, leading to lower margins for pure oxygenate products. In the second quarter, global markets began to adapt to trade fluctuations, providing a more stable operating environment for multiple product chains.
In the second quarter of 2025, LYB generated $351 million in cash from operating activities. The company continued to maintain a balanced capital allocation strategy, spending $539 million on capital expenditures and returning $536 million to shareholders through dividends and stock repurchases. By the end of the quarter, LYB held $1.7 billion in cash and cash equivalents and maintained $6.4 billion in available liquidity.
Strategic Highlights
LYB continues to steadfastly implement its three-pillar strategy, reshaping its asset portfolio through decisive actions to enhance its ability to create long-term value. LYB plans to sell four European assets to reposition with a more cost-advantaged asset base, thereby better serving the global market. To better align investment levels with cash flow, LYB will postpone the construction of the Flex-2 project. The cash improvement program has been expanded, targeting at least $1.1 billion in cash improvements in 2025 and 2026 to protect the balance sheet and support shareholder returns. The company remains committed to maintaining balanced capital allocation to ensure safe and reliable operations, robust growth, and shareholder returns, while sustaining an investment-grade balance sheet.
In the third quarter, LYB expects integrated polyethylene margins in North America to improve, primarily due to a planned maintenance completed in April and price increases supported by strong domestic demand and export growth. In Europe, stable seasonal demand and favorable feedstock costs are expected to continue. The ongoing capacity optimization in the region is expected to help achieve a regional supply-demand balance. The margins for oxyfuel products are expected to remain low throughout the summer. LYB will continue to prudently assess potential risks and opportunities related to the evolving tariff policies and global trade flows.
To align with global demand and the company's maintenance schedule, LYB expects third-quarter operating rates for North American Olefins & Polyolefins (O&P) assets to be 85%, European O&P assets to be 75%, and Intermediates & Derivatives (I&D) assets to be 80%.
【Copyright and Disclaimer】The above information is collected and organized by PlastMatch. The copyright belongs to the original author. This article is reprinted for the purpose of providing more information, and it does not imply that PlastMatch endorses the views expressed in the article or guarantees its accuracy. If there are any errors in the source attribution or if your legitimate rights have been infringed, please contact us, and we will promptly correct or remove the content. If other media, websites, or individuals use the aforementioned content, they must clearly indicate the original source and origin of the work and assume legal responsibility on their own.
Most Popular
-

AI Computing Power Demand Ignites Electronic Fabrics! China Jushi Hits Limit Up! Domestic Substitution Welcomes Golden Window
-

Focus on going global! kingfa sci. leads, huitong, preter, and kumho nire follow, china’s modified plastics frenziedly expanding worldwide
-

Back-to-back major joker moves! covestro’s 1.32 million ton mdi dual-line expansion and hdi acquisition reshape global polyurethane landscape
-

Evonik Parts Ways With The Polyester Business! A Strategic Retreat By A Germany Chemical Giant And The Global Industry Shift
-

PA66 Cost and Profit: Broad-Based Weakness in the Feedstock Market Continues to Erode Cost Support for PA66 (202606)


