


K 2025 Exhibition: European Plastics Industry in Crisis—European Plastics Association Report
According to the latest annual data from Plastics Europe, Europe's market share in global plastic production has plummeted from 22% in 2006 to only 12% in 2024.
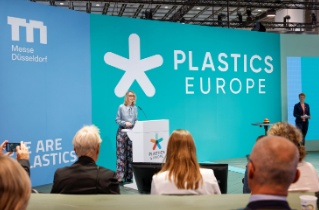
The European Plastics Association announced at a press conference on October 8 during the K 2025 plastics exhibition in Düsseldorf, Germany, that the industry's sales have also decreased by 13% over the past three years, shrinking from 457 billion euros in 2022 to 398 billion euros in 2024.
The association pointed out that this data confirms the competitiveness of the European plastics manufacturing industry is rapidly and continuously declining, and the industry is on the brink of collapse.
Despite a slight stabilization in European plastic production in 2024, with a year-on-year increase of 0.4% reaching 54.6 million metric tons (MMt), the association emphasized that this marginal growth came after a record decline in 2023, when European plastic production plummeted by 7.6% compared to the previous year. In 2018, European plastic production had reached as high as 62.3 million metric tons.
The association stated that the decline in Europe stands in stark contrast to the industrial prosperity being experienced in other regions.
Global polymer production continues to grow.
According to data from Plastics Europe, global plastic production in 2024 is expected to increase by 4.1% year-on-year, reaching 430.9 million tons, a 16.3% increase from 370.6 million tons in 2018. Currently, Asia accounts for 57.2% of global plastic production, with China alone accounting for 34.5%, almost three times the production of the entire European Union. The association's data also shows that fossil-based plastics account for 387 million tons of the total global production, making up nearly 90%.
Europe's previous leading position in the field of recycled plastics is being surpassed by China and the broader Asian region. Although recycled plastics account for 15.4% of the EU's plastic production in 2024, the association points out that this figure reflects a significant 18.9% decrease in fossil-based plastic production since 2018, rather than a notable increase in recycled plastic production. In 2024, Europe's fossil-based plastic production reaches 43.3 million tons, accounting for nearly 80% of the total production.
In 2024, the total production of recycled plastics in the European Union stabilized at 8.4 million tons. Among them, the mechanical recycling volume increased by 2.7%, reaching 7.7 million tons; the chemical recycling volume remained at 110,000 tons without any growth; the production of bio-based plastics, on the other hand, decreased by 25%, falling to 600,000 tons.
However, the association stated that last year, global production of recycled plastics surged to 43.9 million tons, surpassing 10% of the global total for the first time. In 2024, China alone produced 13.4 million tons of recycled plastics, "almost double the production in Europe."
Alarm bells ring.
On October 8, Virginia Janssens, Managing Director of Plastics Europe, stated: "With competitiveness collapsing, the European plastics industry is on the edge of a cliff. The European Commission and the capitals of member states should be sounding the alarm."
She pointed out that maintaining a sufficient scale of local production can avoid over-reliance and enhance Europe's security. "Our political leadership must make a choice: should Europe build the world's first circular plastic system, or achieve decarbonization through further deindustrialization? The implementation speed of the Clean Industry Agreement urgently needs to be accelerated."
Janssens said, "In the absence of clear policy support, our decarbonization and circular transformation are stagnating." She added that it is currently necessary to utilize all available recycling technologies while implementing effective market-driven measures.
European plastic manufacturers are facing issues such as high energy costs, climate-related taxes, and rising raw material prices. The European Plastics Association stated that these factors are "eroding the industry's competitiveness and accelerating the process of asset sales and plant closures."
Tariff Threats Persist
The association pointed out that the plastic trade deficit of the 27 EU countries has slightly improved, narrowing from 800,000 tons in 2023 to 200,000 tons in 2024. This improvement is attributed to a 10% increase in exports: in 2024, the EU's plastic export volume is expected to be 13.1 million tons, while the import volume is expected to be 13.3 million tons.
"However, changes in the global tariff system still pose a significant threat. The United States is the largest source of polymer imports for Europe, accounting for 18.9% of the European market. At the same time, the United States is also the fourth largest export market for EU polymers, accounting for 7.7% of the EU export market," the association stated.
Benny Mermans, the Chairman of the European Plastics Association, described the current situation of the European plastics industry as a "critical turning point," calling for urgent political support and regulatory frameworks. He stated, "While innovation and investment accelerate in other continents, Europe is facing a decline in revenue and a slowdown in production. Our region urgently needs political support and policy frameworks to revitalize investment and ensure the resilience and competitiveness of supply chains. Europe must act immediately."
The association calls on the EU and national governments to take urgent action in several areas, including addressing the European energy cost crisis, strengthening the enforcement of EU border regulations (including those related to imports), and promoting investment in the European recycled plastics production sector.
The association emphasizes the need to cultivate strong market demand for recycled plastics by setting ambitious recycled content targets and other incentive measures.
【Copyright and Disclaimer】This article is the property of PlastMatch. For business cooperation, media interviews, article reprints, or suggestions, please call the PlastMatch customer service hotline at +86-18030158354 or via email at service@zhuansushijie.com. The information and data provided by PlastMatch are for reference only and do not constitute direct advice for client decision-making. Any decisions made by clients based on such information and data, and all resulting direct or indirect losses and legal consequences, shall be borne by the clients themselves and are unrelated to PlastMatch. Unauthorized reprinting is strictly prohibited.
Most Popular
-

AI Computing Power Demand Ignites Electronic Fabrics! China Jushi Hits Limit Up! Domestic Substitution Welcomes Golden Window
-

Focus on going global! kingfa sci. leads, huitong, preter, and kumho nire follow, china’s modified plastics frenziedly expanding worldwide
-

Back-to-back major joker moves! covestro’s 1.32 million ton mdi dual-line expansion and hdi acquisition reshape global polyurethane landscape
-

Evonik Parts Ways With The Polyester Business! A Strategic Retreat By A Germany Chemical Giant And The Global Industry Shift
-

PA66 Cost and Profit: Broad-Based Weakness in the Feedstock Market Continues to Erode Cost Support for PA66 (202606)


