


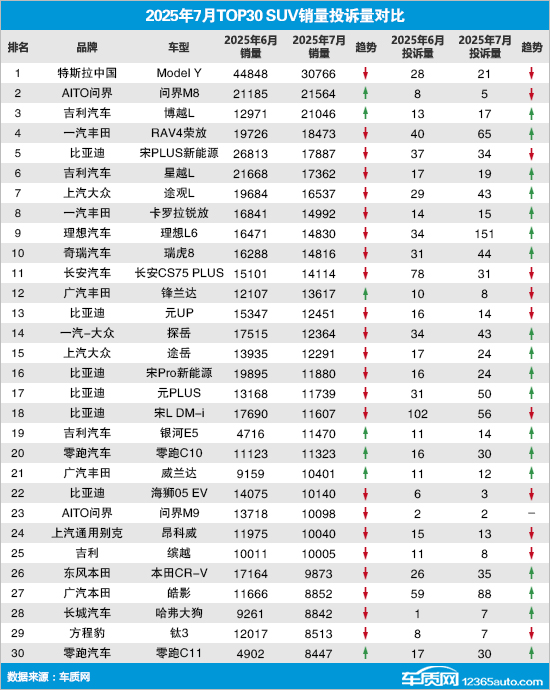
July 2025 Top 30 SUV Sales and Complaint Volume Corresponding Review
According to the national automobile production and sales data provided by the China Passenger Car Association, the cumulative retail sales of the domestic SUV market in July 2025 were 901,000 units, down 13.4% month-on-month and up 6.3% year-on-year. During the same period, Car Quality Network received 7,933 valid complaints from car owners against SUVs, an increase of 39.1% month-on-month and 64.6% year-on-year. After excluding information from complainants who voluntarily withdrew their complaints, the ranking of the TOP30 SUV sales complaints for July 2025 is as follows:

Independent brands dominate the market as mid-size SUV sales surge and then decline.
In July, domestic SUV sales experienced a decline after peaking, dropping below one million units once again. Affected by the broader environment, most models on the sales chart saw varying degrees of month-on-month declines. Among them, Dongfeng Honda CR-V led the drop with a decline of 42.5% compared to June. Meanwhile, seven models on the chart experienced growth against the trend, with the Geely Galaxy E5, which has been on the market for just a year, leading the pack with a month-on-month increase of more than 1.4 times, rejoining the "10,000 units club" after three months.
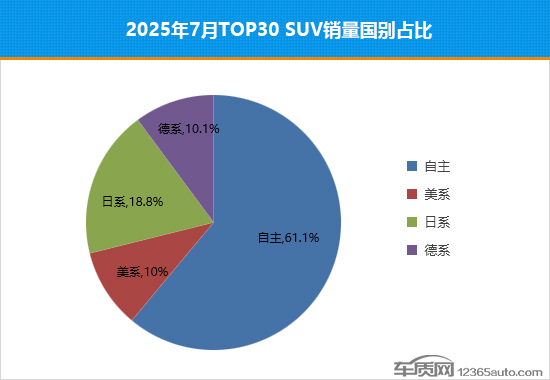
In July, the market share of domestic brands further expanded, increasing by 3.9 percentage points compared to June. In addition, Japanese brands performed well this month, with both the number of models on the list and their sales share increasing, the latter rising by 3.1 percentage points month-on-month.
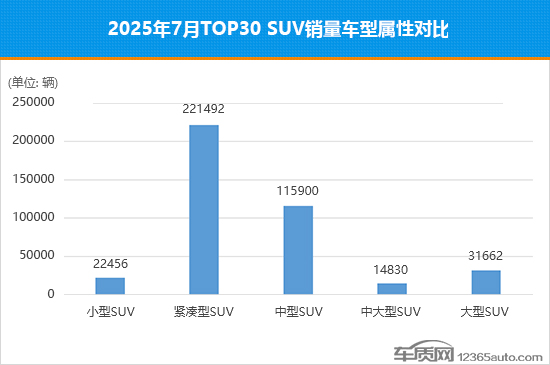
This month, compact SUV sales continued to maintain a significant lead but decreased by 8.3% compared to June. In addition, the sales of other vehicle types also declined to varying degrees month-on-month, with mid-size SUVs experiencing the largest drop, falling by 33.6% compared to the previous month. Sales of mid-to-large SUVs decreased by approximately 10% month-on-month, reaching the lowest point of the year.
The proportion of quality issues reaches a record high, with "steering system abnormal noise" becoming a growing complaint point.
Compared to the significant decline in overall sales, more than 60% of the models on the list saw an increase in complaint volumes month-on-month, with some models even experiencing a doubling in complaints. For example, the Li Auto L6 saw its complaints soar to over 100 in July, representing a month-on-month increase of more than 3.4 times. In contrast, 11 models experienced a month-on-month decrease in complaint volumes, with the Changan CS75 PLUS standing out by dropping 60.3%. Additionally, the complaint volumes for the BYD Song L DM-i and BYD Haishi 05 EV also showed a significant decline, falling 45.1% and 50% respectively compared to June, indicating a positive short-term reputation performance.
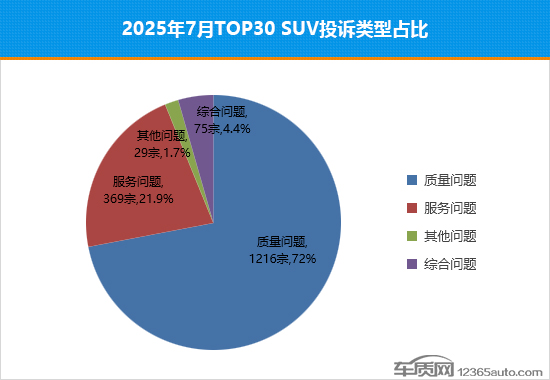
In July, the number of complaints due to quality issues increased by 41.2% compared to the previous month, with the proportion rising by 7.6 percentage points from June, setting a record high for the year. In terms of changes in complaint fault points, "audio-visual system faults" remained at the top, with the number of complaints increasing by more than 50%. Notably, "steering system noise" rose to the second place this month, with the number of complaints increasing nearly 3.9 times month-on-month, becoming a new point of complaint growth. On the other hand, service-related complaints were similar to last month in terms of volume, but their proportion fell by 6.1 percentage points. "System upgrade issues" became the focus of complaints, with the number of complaints increasing nearly fourfold month-on-month.
The complaint-to-sales ratio of 22 models performs better than the same class.
According to the statistical rules of the Car Quality Network's complaint-to-sales ratio, the number of complaints for a vehicle model includes all valid complaints for the month (including cases where the complaint was properly resolved and the complainant voluntarily requested withdrawal). Upon calculation, the average SUV complaint-to-sales ratio for July was 55.8 per 10,000 units, showing a significant increase compared to June, and the short-term trend indicates a sharp deterioration.
A total of 22 SUV models had a complaint-to-sales ratio lower than the average in July. Among them, four models saw a month-on-month decline in this ratio, with the Geely Galaxy E5 standing out as the most remarkable, showing notable short-term improvement.
Key Model Analysis
The reputation is not good, and the market performance of the Leapmotor C11 is unlikely to stabilize and recover in the short term.
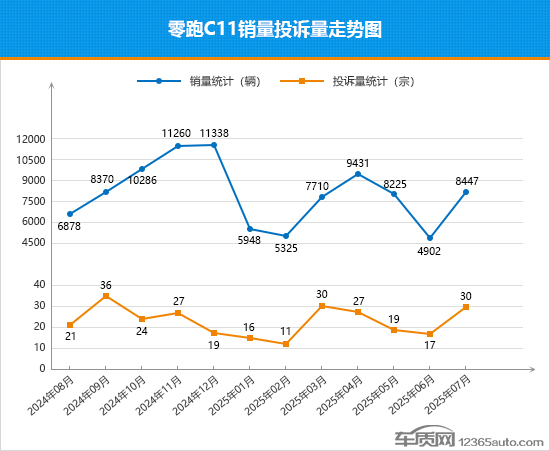
As a veteran member of the new power brands, the Leapmotor C11 has been on the market for over four years and has now become the sales pillar of the Leapmotor brand. However, after entering 2025, its market performance fell into a slump, with sales trends fluctuating significantly and repeatedly hitting rock bottom. In July, the Leapmotor C11 experienced a rebound from the bottom, with sales increasing by 72.3% month-on-month, but it still remains some distance from breaking the ten thousand mark. Unlike the sales trend, the monthly complaint trend for the Leapmotor C11 has been relatively stable, but recently there have been signs of deteriorating reputation, with complaints in July rising by 76.5% month-on-month, rebounding to a high level. According to data from the Car Quality Network, the complaint issues for the Leapmotor C11 are relatively scattered, with "power battery failure" and "charging failure" receiving more complaints. From the change in the complaint-to-sales ratio in July, the value has increased month-on-month, ranking in the middle to lower range among all listed models, with overall performance not as good as in June. In the short term, the market performance of the Leapmotor C11 may continue its fluctuating trend, and when it can stabilize and rebound remains uncertain.
2. The complaint-to-sales ratio has improved significantly, marking a turning point in the market for the Galaxy E5.
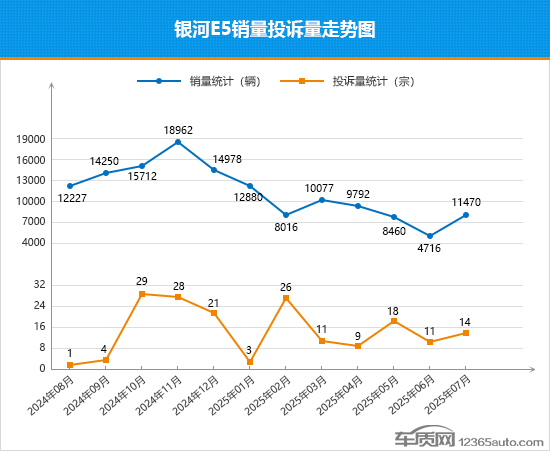
The Galaxy E5, which has been on the market for just over a year, experienced a market turnaround in July, with sales surpassing 10,000 units again after three months, ending the previous downward trend of three consecutive months of decline. From the sales and complaint trends over the past year, it can be seen that after reaching a peak in November 2024, sales started to decline sharply, hitting a low in June. Unlike the sales trend, the monthly complaint trend for the Galaxy E5 has been volatile, but the number of complaints has remained relatively low in most months. Starting from the second quarter of this year, the monthly complaint trend has gradually stabilized, and the short-term reputation is commendable. From the change in the complaint-to-sales ratio of the Galaxy E5 this month, the figure has significantly decreased compared to June, with overall performance visibly better than in June. The rebound in July might be a turning point for the Galaxy E5, coinciding with the release of a new model in the same month, which has been upgraded in terms of range, safety, intelligence, and driving control, thus enhancing its market competitiveness. With this opportunity, the market performance of the Galaxy E5 is expected to continue to recover, ushering in a new stage of development.
【Copyright and Disclaimer】The above information is collected and organized by PlastMatch. The copyright belongs to the original author. This article is reprinted for the purpose of providing more information, and it does not imply that PlastMatch endorses the views expressed in the article or guarantees its accuracy. If there are any errors in the source attribution or if your legitimate rights have been infringed, please contact us, and we will promptly correct or remove the content. If other media, websites, or individuals use the aforementioned content, they must clearly indicate the original source and origin of the work and assume legal responsibility on their own.
Most Popular
-

AI Computing Power Demand Ignites Electronic Fabrics! China Jushi Hits Limit Up! Domestic Substitution Welcomes Golden Window
-

Focus on going global! kingfa sci. leads, huitong, preter, and kumho nire follow, china’s modified plastics frenziedly expanding worldwide
-

Back-to-back major joker moves! covestro’s 1.32 million ton mdi dual-line expansion and hdi acquisition reshape global polyurethane landscape
-

Evonik Parts Ways With The Polyester Business! A Strategic Retreat By A Germany Chemical Giant And The Global Industry Shift
-

PA66 Cost and Profit: Broad-Based Weakness in the Feedstock Market Continues to Erode Cost Support for PA66 (202606)


