


Japanese and Korean Batteries: Hard to Escape the 80/20 Rule
Once the half-year data of power batteries is released, the situation becomes clearer.
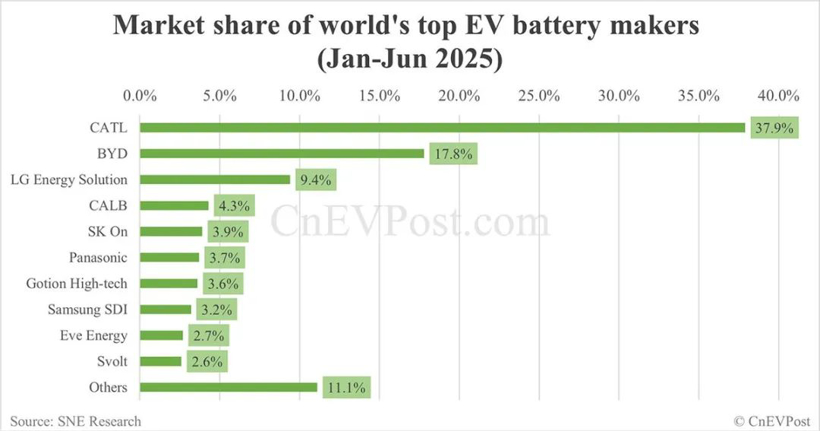
According to the latest data from the Korean research institute SNE Research, in the first half of 2025, the global installed capacity of electric vehicle (EV, PHEV, HEV) power batteries will reach 504.4 GWh, a year-on-year increase of 37.3%. Meanwhile, the market share of once-dominant Japanese and Korean battery manufacturers continues to decline.
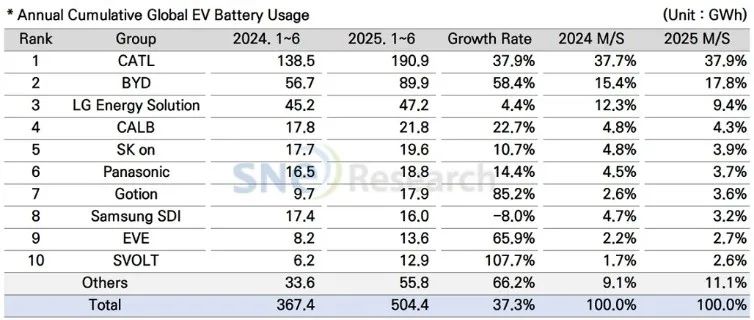
The combined installed capacity of LG Energy Solution, SK On, Samsung SDI, and Panasonic is 101.6 GWh, with a total market share of 20.1%, a year-on-year decrease of 6.1%. In other words, they couldn't outperform CATL alone (190.9 GWh). At the same time, they couldn't escape the "80/20 rule."
Chinese companies occupy six of the top 10 positions, with a total installed capacity of 347 GWh, accounting for 68.8% of the market share, a year-on-year increase of 4%, continuing to advance rapidly. As the global focus of the power battery industry shifts, the lithium iron phosphate technology continues to "move from victory to victory."
01The three major Korean companies cannot beat BYD.
In this ranking released by SNE, not to mention CATL, even when the three Korean battery giants—LG Energy Solution, SK On, and Samsung SDI—"join forces," they still couldn't surpass BYD, which ranked second. BYD's installed capacity reached 89.9GWh, raising its global market share to 17.8%.
It must be said that the momentum of Chinese battery companies has forced the three major South Korean firms to "retreat significantly," with their market share declining by 5.4% year-on-year.
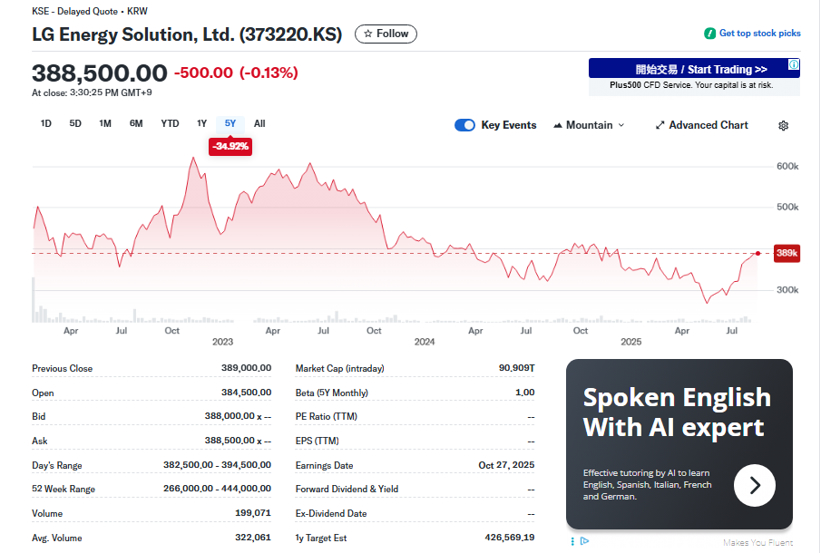
Among the three Korean "brothers," the one with the most significant decline in market share is none other than LG Energy Solution. Although LG Energy Solution still ranks third with an installed capacity of 47.2 GWh, its year-on-year growth is only 4.4%, and its market share has dropped from 12.3% in 2024 to 9.4% this year.
According to SNE's analysis, the main reason is that LG Energy Solution's batteries are primarily used by automobile manufacturers such as Tesla, Chevrolet, Kia, and Volkswagen. In the case of Tesla, "due to the decline in sales of models equipped with LG Energy Solution batteries, Tesla's usage of these batteries decreased by 41.1%."
Of course, thanks to the strong global sales of the Kia EV3 and the expanding sales of the Equinox, Blazer, and Silverado EVs, which are equipped with the Ultium platform, in the North American market, LG Energy Solution was able to maintain some of its reputation.
The root cause of LG Energy Solution's predicament lies in its wavering technological strategy. Hesitation between ternary lithium batteries and lithium iron phosphate batteries led to missing out on Tesla's 4680 battery orders. In addition, shortcomings in cost control are also evident. According to media reports, the unit manufacturing cost at its Nanjing factory is 18% higher than that of CATL, resulting in a gradual loss of competitiveness in the mid- to low-end market.
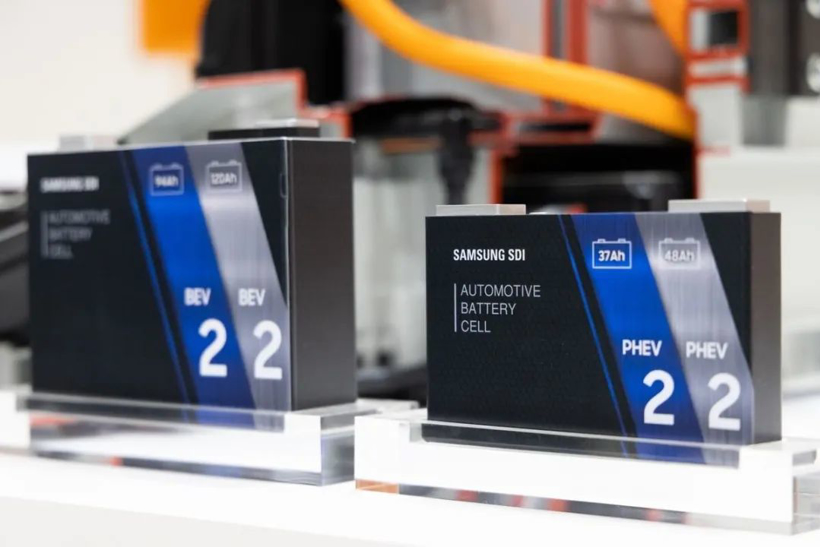
Among these three, the worst off is actually Samsung SDI. Samsung SDI is the only company in the top 10 with negative growth. Due to its heavy bet on solid-state batteries, its market share has dropped from 4.7% in 2024 to 3.2% this year. Moreover, according to analysts from Morningstar, Samsung SDI is expected to incur an operating loss of 398 billion Korean won (approximately 2.06 billion RMB) in 2025.
SK On ranked fifth with an installed capacity of 19.6 GWh, representing a year-on-year increase of 10.7%. However, its market share dropped from 4.8% in 2024 to 3.9% this year. The main reason for the decline is the weakening demand for its batteries in the European and North American markets.
Interestingly, since 2021, SK On has been operating at a loss. In 2024 alone, the loss amounted to as much as 1.127 trillion Korean won (approximately 1.797 billion RMB). Moreover, the projected loss is expected to continue expanding in 2025. For example, a research report by Nomura Orient International Securities estimates that SK On's operating profit will be a loss of 340 million USD (approximately 2.44 billion RMB) this year.
The so-called "what goes around comes around," the Korean Big Three went from dominating the world to falling from grace, all within just a few years.
In fact, as early as the first quarter of 2020, LG Chem (the predecessor of LG Energy Solution) already held a 27.1% share of the global power battery market. The combined market share of Samsung SDI and SK On also reached 21.1%, with the "big three" South Korean companies accounting for nearly 50% of the global market. Compared to their peak in 2020, the market share of the Korean trio has dropped by about two-thirds over the past four years, which is quite lamentable.
Of course, behind this is the rapid rise of Chinese battery companies and the mainstream adoption of lithium iron phosphate (LFP) technology. From 2020 to the present, the market share of LFP batteries in the global power battery market has soared from less than 20% in certain months at its lowest point to 78% in July 2025.
Therefore, the three major Korean companies that once abandoned the lithium iron phosphate (LFP) route are now forced to catch up urgently, including showcasing their LFP technology reserves at various exhibitions. However, they are still far behind in mass production. For example, the LFP battery production line at LG Energy Solution's Poland factory currently has a yield rate of just over 70%, which is significantly lower than the over 90% or even 95% yield rates achieved by leading Chinese companies.
It is worth mentioning that there are still three Korean companies holding their positions, while Panasonic is the only Japanese battery company to make it into the TOP10. With an installed capacity of 18.8GWh and a growth rate of 13.9%, Panasonic has risen to sixth place, showing a relatively obvious recovery trend. However, its market share has dropped from 4.5% in 2024 to 3.7% this year.
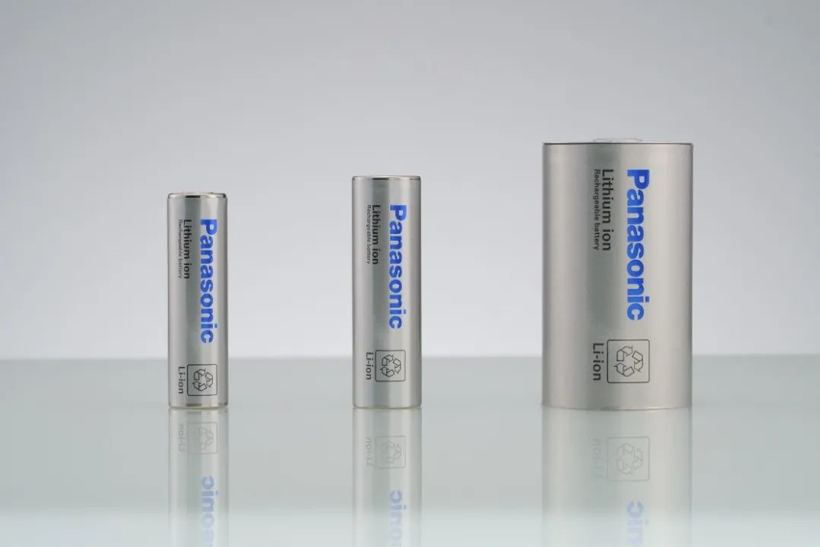
Certainly, its recovery has benefited from its deep ties with Tesla. After increasing the energy density of the 21700 battery to 290Wh/kg and reducing costs by 12%, Panasonic regained competitiveness in the Model 3/Y vehicles. However, the risk of Panasonic's reliance on a single customer is also very evident.
02 Technical confidentiality issues
For Japanese and Korean battery companies, the current times are very challenging. Facing multiple operational pressures and market challenges, they have no choice but to initiate strategic business adjustments. For instance, LG Energy Solutions announced at the beginning of this year that it decided to cut its annual capital investment by 30%.
In April this year, LG Energy Solution announced its formal withdrawal from an integrated battery industry investment project in Indonesia valued at 8.45 billion US dollars (approximately 130 trillion Indonesian rupiah). However, shortly thereafter, LG Energy Solution announced an additional investment of 1.7 billion US dollars in the HLI Green Power battery plant, which is scheduled to officially commence operations in July 2024. This plant, with a production capacity of 10 GWh, is a joint venture established by LG Energy Solution and Hyundai Motor Company.
In addition, in April LG also announced that, in view of the continued weak demand in the global electric vehicle (EV) market, it will completely withdraw from the EV charging pile business. Meanwhile, news of layoffs at LG's Nanjing factory occasionally emerges domestically. Whether out of helplessness or initiative, the strategic contraction is visible.
In May this year, Panasonic Holdings CEO Yuki Kusumi announced that Panasonic would postpone the construction of its third battery plant in the United States and instead focus on launching production at its second plant in Kansas. The facility is planned to have an annual capacity of 30 GWh and is expected to reach full production in 2026. However, due to sluggish sales of related Tesla models, its main customer, Panasonic is reassessing its production plans.
In the intense international competition, a very important issue that has emerged is the confidentiality of China's lithium iron phosphate preparation technology.
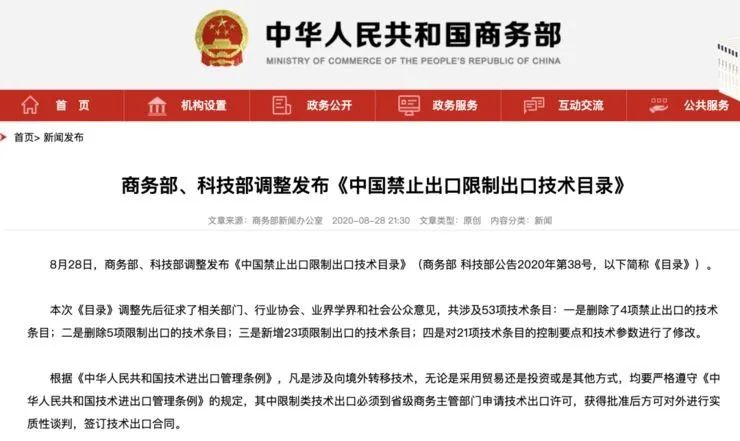
As is well known, lithium iron phosphate (LFP) is a Chinese advantage technology. According to the draft amendment soliciting opinions on the "Catalogue of Technologies Prohibited or Restricted from Export" issued by the Chinese Ministry of Commerce on January 2, 2025, "battery cathode material preparation technology" has been explicitly included in the restricted export category, covering lithium iron phosphate, lithium manganese iron phosphate, and related raw material preparation technologies.
The adjustment aims to control the outflow of next-generation high-end lithium iron phosphate battery technology, consolidate domestic industry advantages, and address international technology competition. This includes the actions of the European Union investigation team this year, which demanded sensitive information such as battery formulas from Chinese car companies, indicating that the national level has already realized the importance of technological confidentiality.
Based on the current situation, due to the previous "wrong technology path" lag, Korean companies are also initiating a "talent poaching" strategy to accelerate progress. For example, in March of this year, according to a report by Jiemian News, LG Energy Solution planned to bring in the core team from Chinese battery company Gotion High-Tech, with a total of 200 employees joining in three batches, covering all key processes from research and development to production and sales.
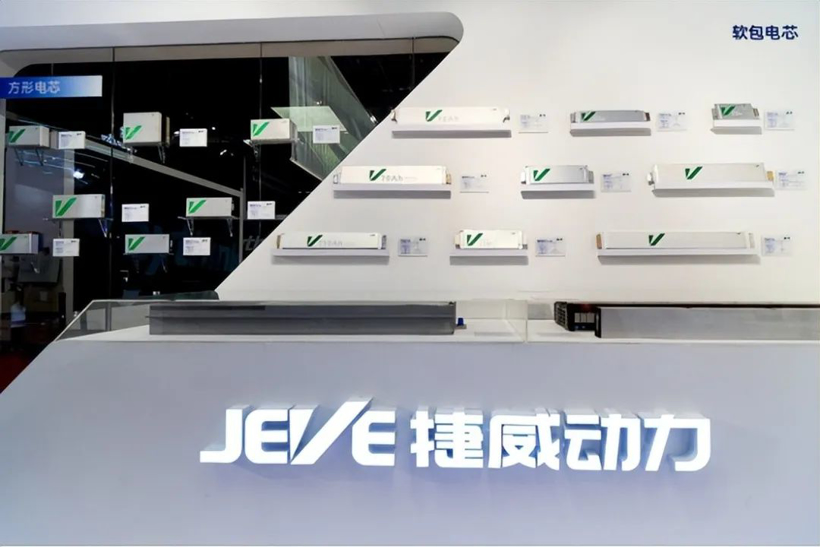
In 2024, Korean media also reported that LG Energy Solutions is interested in the talent team and lithium iron phosphate technology of Jiewei Power, with no intention of purchasing its fixed assets such as plants and equipment.
Despite its small team size, Gotion High-tech has the advantage of covering research and development, production, and sales, and possesses the complete R&D capability for prismatic lithium iron phosphate batteries. Although its capabilities are not outstanding among Chinese battery companies, they are a timely help for Korean companies that have significant shortcomings in the lithium iron phosphate business.
The primary task of joining the Jiewei Power R&D team at LG's Nanjing factory is to develop high-density, ultra-fast charging prismatic lithium iron phosphate batteries based on Longpan Technology's high-pressure solid lithium iron phosphate material. In addition, besides Hangke Technology, which has long provided formation and capacity grading equipment for LG New Energy, LG New Energy has also engaged with Chinese equipment suppliers such as Lead Intelligence and Liyuanheng, hoping to quickly enhance mass production capacity.
Looking back, the key reason for the comprehensive retreat of South Korean battery companies lies in their weak lithium iron phosphate battery business. As competition intensifies, whether there have been any improper actions cannot be rashly speculated. However, it is still very necessary for our domestic enterprises and relevant departments to against technology leakage.
It must be said that ternary lithium batteries contributed to the success of Korean battery companies in the past, while lithium iron phosphate batteries have contributed to the success of Chinese battery companies. Nowadays, in order to avoid market elimination, Chinese battery companies need to continue to increase research and commercial validation of new technologies, including sodium-ion batteries, large cylindrical batteries, solid-state batteries, etc., to be well-prepared.
Overall, the data from the first half of 2025 also reflects what industry insiders have summarized: Chinese companies are rapidly capturing the market through a "fast technological iteration + scale-driven cost reduction" model. The competitive focus in the power battery industry has shifted from a single technological barrier to a comprehensive efficiency contest centered on "technology conversion efficiency, cost control capability, and market responsiveness." The future competition remains full of uncertainties.
【Copyright and Disclaimer】The above information is collected and organized by PlastMatch. The copyright belongs to the original author. This article is reprinted for the purpose of providing more information, and it does not imply that PlastMatch endorses the views expressed in the article or guarantees its accuracy. If there are any errors in the source attribution or if your legitimate rights have been infringed, please contact us, and we will promptly correct or remove the content. If other media, websites, or individuals use the aforementioned content, they must clearly indicate the original source and origin of the work and assume legal responsibility on their own.
Most Popular
-

AI Computing Power Demand Ignites Electronic Fabrics! China Jushi Hits Limit Up! Domestic Substitution Welcomes Golden Window
-

Focus on going global! kingfa sci. leads, huitong, preter, and kumho nire follow, china’s modified plastics frenziedly expanding worldwide
-

Back-to-back major joker moves! covestro’s 1.32 million ton mdi dual-line expansion and hdi acquisition reshape global polyurethane landscape
-

Evonik Parts Ways With The Polyester Business! A Strategic Retreat By A Germany Chemical Giant And The Global Industry Shift
-

PA66 Cost and Profit: Broad-Based Weakness in the Feedstock Market Continues to Erode Cost Support for PA66 (202606)


