


International Crude Oil Price Drop Causes Over 29 Billion Loss for "Big Three" Oil Companies in First Half; Plastic Market Sees Local Fluctuations, PE Drops Up to 200
The "Three Oil Giants" earned a net profit of 175 billion yuan in the first half of the year, with a decrease of over 29 billion yuan!

With the release of its semi-annual report on August 27 by CNOOC (600938.SH/00883.HK), all three major state-owned oil and gas enterprises in China have disclosed their interim results. In the first half of this year, affected by the decline in international oil prices, all three companies saw both revenue and net profit decrease, with their combined net profit attributable to shareholders reaching 175.023 billion yuan.
The financial report shows,In the first half of the year, PetroChina (601857.SH/0857.HK) achieved a revenue of 1.45 trillion yuan, a year-on-year decrease of 6.7%; the net profit attributable to shareholders was 84.007 billion yuan, a year-on-year decline of 5.4%. During the same period, Sinopec achieved a revenue of approximately 1.41 trillion yuan, a year-on-year decrease of 10.6%; the net profit attributable to shareholders was 21.483 billion yuan, a sharp year-on-year drop of 39.8%. CNOOC's revenue in the first half of the year was 207.608 billion yuan, a year-on-year decrease of 8%; the net profit attributable to shareholders reached 69.533 billion yuan, a year-on-year decline of 13%. In total, the three companies earned 29.05 billion yuan less than the same period last year, equivalent to nearly 160 million yuan less per day.
This is the first time in five years that PetroChina has experienced a decline in net profit.Regarding the decline in revenue, China National Petroleum Corporation stated that it was mainly due to the combined effects of the decrease in crude oil and refined oil prices as well as changes in the sales volume of oil and gas products.
At the performance meeting held on the 27th, the company's Vice President He Jiangchuan explained that in the first half of the year, despite a 15.1% year-on-year decline in Brent oil prices, the operating profit and net profit attributable to the parent company of China National Petroleum Corporation remained at historically high levels for the same period, with changes far smaller than the decline in international oil prices. Free cash flow increased by 11.5% year-on-year, also reaching the best level for the same period in history.
In the first half of the year, China National Petroleum Corporation's oil and gas equivalent production reached 924 million barrels, a year-on-year increase of 2.0%. Both natural gas production and oil and gas equivalent production hit record highs for the same period in history, with the proportion of natural gas production in the oil and gas equivalent production continuing to rise.
From a business segment perspective, its oil and gas and new energy divisions remain the largest sources of profit for China National Petroleum Corporation. In the first half of the year, they achieved an operating profit of 85.686 billion yuan, down 6.8% year-on-year, mainly due to a decline in crude oil sales prices. The refining, chemical, and new materials division realized an operating profit of 11.056 billion yuan, a decrease of 2.573 billion yuan compared to the same period last year, due to narrowed gross margins in refining and chemical businesses. The sales division's operating profit dropped 25.2% to 7.562 billion yuan, attributed to lower refined oil sales prices and reduced gross profits in international trade business. The natural gas sales division's operating profit surged 10.8% to 18.626 billion yuan, with a 2.1 percentage point increase in domestic market share.
Regarding the decline in operating profit, Sinopec (600028.SH/00386.HK) stated that the main reasons are the continued decline in crude oil and product prices, resulting in inventory depreciation, the decrease in domestic gasoline and diesel sales volumes and price differentials, as well as the decline in gross profit margins of products such as jet fuel and aromatics.
It is worth noting thatFacing declining domestic demand for refined oil products, PetroChina and Sinopec have shown significant divergence in their refined oil sales.
In the first half of the year, PetroChina processed 690 million barrels of crude oil, showing steady growth. Domestic sales of gasoline, kerosene, and diesel totaled 58.646 million tons, up 0.3% year-on-year, with both kerosene and diesel sales increasing. In contrast, Sinopec processed approximately 120 million tons of crude oil, a year-on-year decrease of 5.3%, and its domestic refined oil product sales reached 87.05 million tons, down 3.4%.
During the reporting period, Sinopec’s net cash flow from operating activities increased by 44.4% year-on-year, and its oil and gas equivalent production reached 260 million barrels, up 2% year-on-year. However, the operating profits of its Exploration and Production, Refining, Marketing and Distribution, and Chemicals divisions all declined to varying degrees. Among them, the Refining division experienced the largest decrease in operating profit, with a drop of 50.4%. The Chemicals division reported an operating loss of 4.2 billion yuan, an increase in loss of 1.1 billion yuan year-on-year.
As a pure upstream oil and gas exploration and development company, CNOOC's performance is more closely related to the fluctuations in international oil prices.
In the first half of the year, CNOOC's net production was nearly 385 million barrels of oil equivalent, representing a year-on-year increase of 6.1%. Both domestic and international production exceeded the best levels in the same period in history, with natural gas production seeing a significant increase of 12.0%. Approximately 69.3% of the aforementioned net production came from China.
CNOOC stated that the company continues to increase reserves and production, promotes quality improvement, cost reduction, and efficiency enhancement, which has partially offset the adverse impact of the decline in international oil prices.
The long-term trend of energy substitution will accelerate the decline in refined oil consumption. Facing the pressure from new energy on the traditional market, the "Big Three Oil Companies" are accelerating the development of non-oil businesses, as seen from the disclosed half-year reports.
At the performance meeting of China National Petroleum Corporation (CNPC), The Paper learned that in the first half of the year, its wind and solar power generation reached 3.69 billion kilowatt-hours, 1.7 times that of the same period last year. The external power supply amounted to 1.92 billion kilowatt-hours, twice that of the same period last year. It secured wind and solar capacity targets of 16.38 million kilowatts and completed an installed capacity of 10.24 million kilowatts. The volume of charging and battery swapping increased by 213% year-on-year, and the profit from non-oil businesses increased by 5.5% year-on-year.
Sinopec's financial report shows that the profit from non-oil businesses in the first half of the year was 3.09 billion yuan, an increase of 17.0% year-on-year. Among them, the profit from convenience store goods and services was 2.93 billion yuan, an increase of 350 million yuan year-on-year, and the service fee from charging business was 500 million yuan, a significant year-on-year increase.
In its half-year report, CNOOC stated that in the first half of the year, the company generated over 900 million kilowatt-hours of green electricity. The deepwater floating wind power platform "Haiyou Guanlan" provided a stable supply of green electricity to the Wenchang oilfield cluster. Additionally, the company purchased and consumed 500 million kilowatt-hours of green electricity. In terms of cultivating new energy and new industries, China's first offshore CCUS project was put into operation on the Enping 15-1 platform.
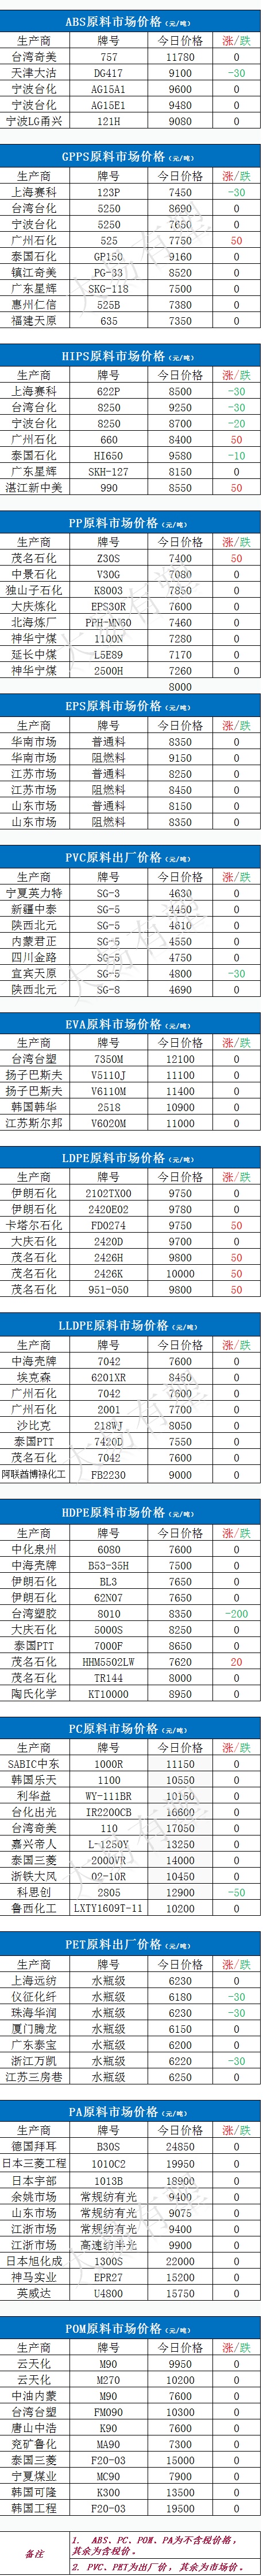
Section 2: Today's Plastic Prices
(The above is a comprehensive summary compiled from The Paper and Dayi Yousu.)
【Copyright and Disclaimer】This article is the property of PlastMatch. For business cooperation, media interviews, article reprints, or suggestions, please call the PlastMatch customer service hotline at +86-18030158354 or via email at service@zhuansushijie.com. The information and data provided by PlastMatch are for reference only and do not constitute direct advice for client decision-making. Any decisions made by clients based on such information and data, and all resulting direct or indirect losses and legal consequences, shall be borne by the clients themselves and are unrelated to PlastMatch. Unauthorized reprinting is strictly prohibited.
Most Popular
-

AI Computing Power Demand Ignites Electronic Fabrics! China Jushi Hits Limit Up! Domestic Substitution Welcomes Golden Window
-

Focus on going global! kingfa sci. leads, huitong, preter, and kumho nire follow, china’s modified plastics frenziedly expanding worldwide
-

PA66 Cost and Profit: Broad-Based Weakness in the Feedstock Market Continues to Erode Cost Support for PA66 (202606)
-

Back-to-back major joker moves! covestro’s 1.32 million ton mdi dual-line expansion and hdi acquisition reshape global polyurethane landscape
-

Evonik Parts Ways With The Polyester Business! A Strategic Retreat By A Germany Chemical Giant And The Global Industry Shift


