


India Polypropylene (PP): Trade, Production Capacity, and Growth Trilogy
Trade: Surge in India's PP imports before BIS regulation extension
Data Source: JLC Network Technology
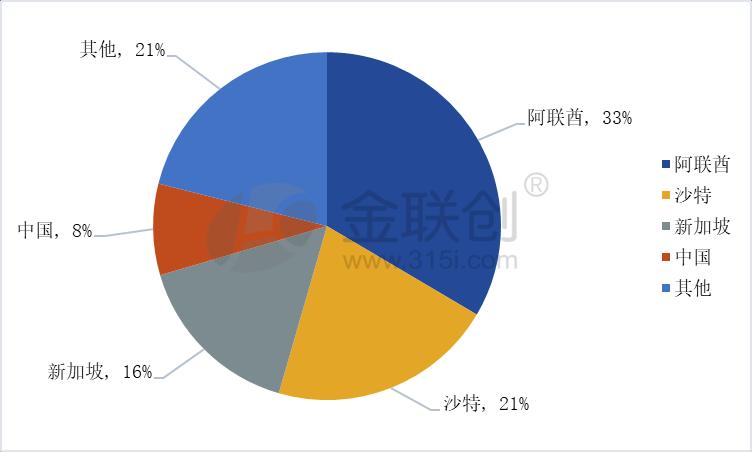
In July, India imported a total of 119,000 tons of polypropylene, with imports from the UAE ranking first, accounting for 33%. This was followed by Saudi Arabia with a 21% share, while Singapore and China also ranked among the top five. Additionally, the volume of polypropylene imported by India in July saw significant growth; although it decreased compared to June, it increased by approximately 48% year-on-year from last year.
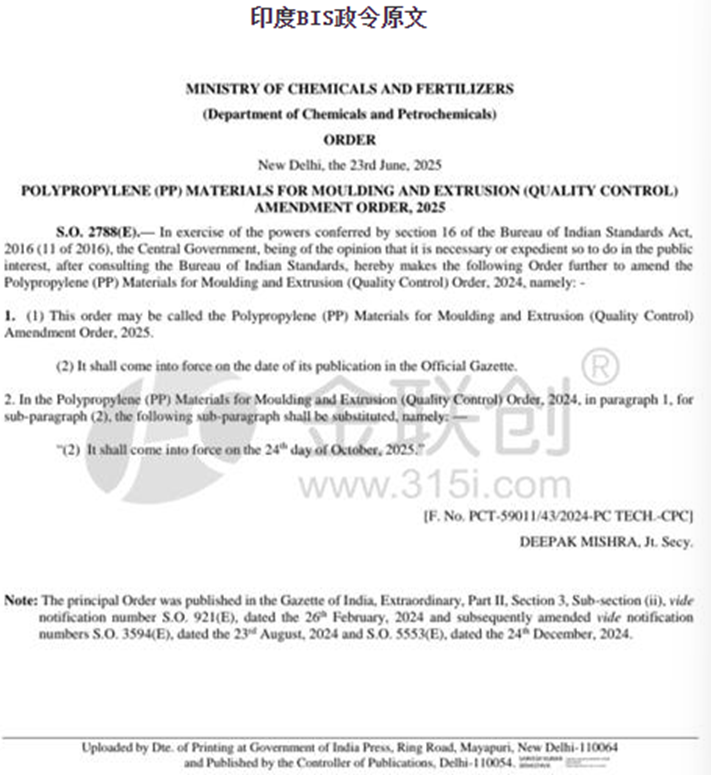
On June 23, the Indian government issued a notice stating that the department has amended the "2024 PP Molding and Extrusion Materials (Quality Control) Order," indicating that the order will take effect on October 24, 2025. This means that the BIS of India has postponed the PP import control to October 24. This is the third postponement since the order was proposed.
Before the issuance of the extension decree on June 23, Indian importers, concerned about potential import disruptions due to the implementation of BIS, took precautionary measures by importing in advance. This led to a significant increase in shipments arriving in July, which were ordered in late May and early June, compared to the same period last year.
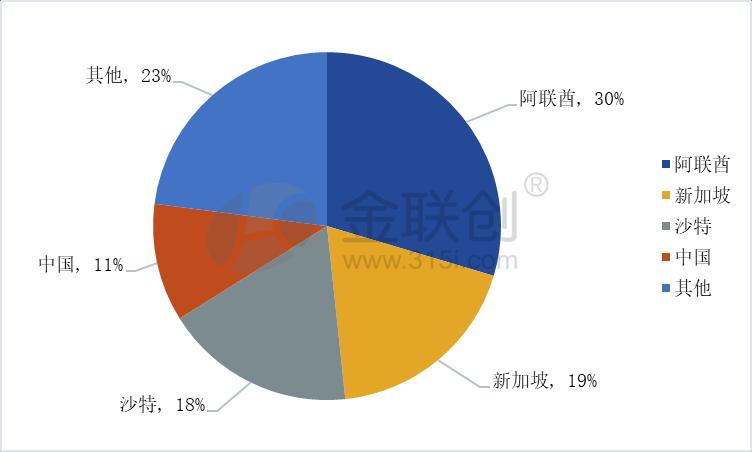
From January to July 2025, India imported a total of 709,000 tons of polypropylene. The top four import sources were roughly the same as in July, with the United Arab Emirates still holding the largest share, followed by Singapore, Saudi Arabia, and China. The UAE accounted for 30% of the imports, leading India's import sources. Singapore and Saudi Arabia each accounted for 19% and 18%, respectively, approximately equivalent. China held an 11% share of the imports, with polypropylene exports to India experiencing a year-on-year increase of about 24% from January to July 2025.
Data source: General Administration of Customs, Jinlianchuang
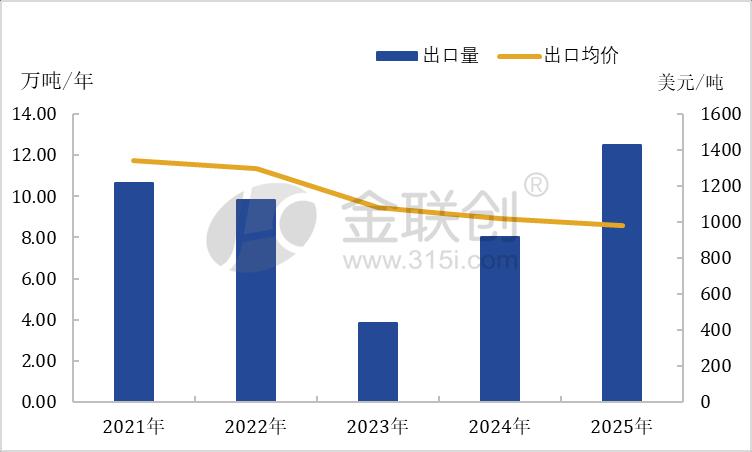
From January to August in the years 2021-2025, China's total polypropylene exports to India showed a fluctuating trend. In the period from January to August 2021, a total of 106,500 tons were exported, while the export volume in the same period of 2023 was the lowest in five years, amounting to 38,400 tons. In 2024, the export volume from January to August increased by 41,600 tons year-on-year, and in 2025 it grew by 45,000 tons to reach 125,000 tons. However, the trend of export average prices differed from the export volume, as the average export price showed a stepwise decline. The average export price from January to August 2021 was 1,343 USD/ton, while in the same period of 2025, it was 978 USD/ton, reflecting a decrease of 365 USD/ton over five years. The situation where China's total export volume of PP increases while the average price decreases is not unique to India but is a reflection of the increasingly fierce competition in the export market.
Production Capacity: India's PP Market Enters a Capacity Boom Period
Data source: Jinlianchuan
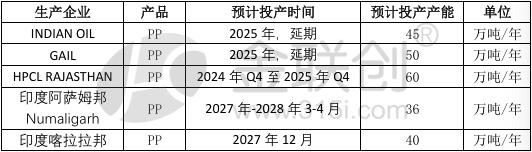
Currently, the main polypropylene production companies in India are Reliance Industries, GAIL, and HPCL. With the growth of India's population and economy, domestic demand is also increasing. As early as 2023, India announced a series of capacity expansion plans. From 2025 to 2027, India is expected to add a total of 2.31 million tons per year of new polypropylene production capacity, but many of the facilities that were planned to be commissioned this year are still delayed.
Growth: GDP and Population Growth Empower Each Other
In 2023, as the country with the largest population in the world, India's GDP reached $3.64 trillion, with a per capita GDP of $2,530.12. In 2024, GDP rose to $3.91 trillion, and per capita GDP reached $2,696.66, with a growth rate of 6.48%, becoming the engine of growth in South Asia.
The Indian government has been committed to increasing the share of manufacturing, exemplified by the rapid growth in passenger car exports, which marks a new chapter for the country's automotive industry and showcases its aspirations in global trade. The automotive industry contributes approximately 7.1% to India's GDP. Its comparative advantages lie in efficient cost labor, engineering talent, a robust supplier base, and an improving business environment. Multiple factors continually enhance the attractiveness of its automotive manufacturing base.
As one of the raw materials for everyday consumer goods, automotive manufacturing, and medical supplies, polypropylene is closely related to the consumption and travel sector. The growth of the Indian market economy has led to an increase in domestic demand, prompting plans for future capacity expansion, while also providing more opportunities for exports. Neighboring countries such as Nepal, Vietnam, and Mexico in South America are major markets for India's polypropylene exports. In the future, with the rapid rise of China's polypropylene exports and the economic growth dividends in the Indian market, trade relations between China and India are expected to become even closer.
【Copyright and Disclaimer】The above information is collected and organized by PlastMatch. The copyright belongs to the original author. This article is reprinted for the purpose of providing more information, and it does not imply that PlastMatch endorses the views expressed in the article or guarantees its accuracy. If there are any errors in the source attribution or if your legitimate rights have been infringed, please contact us, and we will promptly correct or remove the content. If other media, websites, or individuals use the aforementioned content, they must clearly indicate the original source and origin of the work and assume legal responsibility on their own.
Most Popular
-

AI Computing Power Demand Ignites Electronic Fabrics! China Jushi Hits Limit Up! Domestic Substitution Welcomes Golden Window
-

Focus on going global! kingfa sci. leads, huitong, preter, and kumho nire follow, china’s modified plastics frenziedly expanding worldwide
-

PA66 Cost and Profit: Broad-Based Weakness in the Feedstock Market Continues to Erode Cost Support for PA66 (202606)
-

Back-to-back major joker moves! covestro’s 1.32 million ton mdi dual-line expansion and hdi acquisition reshape global polyurethane landscape
-

Evonik Parts Ways With The Polyester Business! A Strategic Retreat By A Germany Chemical Giant And The Global Industry Shift


