


Honeywell Hits $74.5 Billion!
After BASF and Dow successively released their performance for the second quarter of 2025 (BASF's sales fell by 2.1% year-on-year,Net income decreased by 81.4% year-on-year.Dow’s net sales decreased by 7% year-over-year, with a GAAP net loss of $801 million. Honeywell released its earnings report on July 24, stating that its second-quarter performance met or exceeded expectations. Specifically:
In the second quarter, Honeywell's sales reached $10.4 billion (approximately 74.5 billion RMB), an 8% increase year-on-year, with organic sales growing by 5%. Organic sales in its Defense and Space, and UOP businesses both achieved double-digit growth.
Driven by the growth of the building automation business, revenue reached $2.11 billion, an increase of 7% year-on-year, while segment profit grew by 8% to $2.4 billion.
The operating profit margin contracted by 30 basis points to 20.4%, and the departmental profit margin contracted by 10 basis points to 22.9%, both in line with previous expectations.
In the second quarter, earnings per share were $2.45, representing a 4% year-over-year increase. Adjusted earnings per share were $2.75, up 10% year-over-year. Operating cash flow was $1.3 billion, a decrease of 4% compared to the previous year, and free cash flow was $1 billion, down 9% year-over-year.
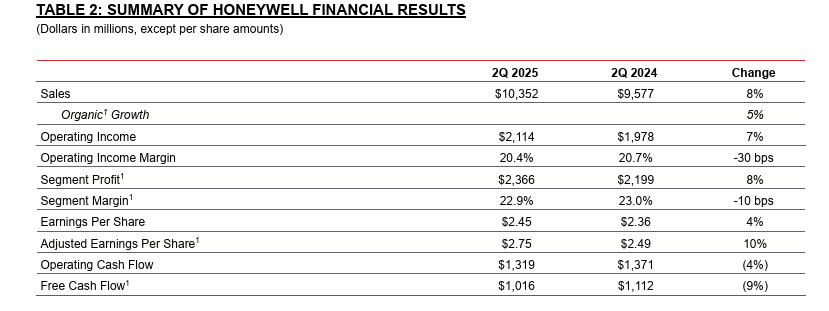
Honeywell has updated its full-year forecasts for sales, segment margin, and adjusted earnings per share. The company now expects full-year sales of $40.8 billion to $41.3 billion, with organic sales growth between 4% and 5%. Segment margin is expected to be between 23.0% and 23.2%, representing a year-over-year increase of 40 to 60 basis points. Adjusted earnings per share are now expected to be in the range of $10.45 to $10.65, which is 20 cents higher than the midpoint of the previous guidance range.
Portfolio Transformation and Development
In February this year, Honeywell announced that its board of directors had completed a comprehensive review of its business portfolio and decided to spin off its Automation and Aerospace businesses. Together with the previously announced Advanced Materials spinoff plan (currently expected to be completed in the fourth quarter of 2025), these initiatives will result in three publicly traded industry leaders, with the overall transformation expected to be fully completed in the second half of 2026. To oversee the transformation process, Honeywell has established a dedicated Separation Management Office to ensure that business leaders can focus on day-to-day operational management.
In the second quarter, Honeywell continued to optimize its product portfolio and prudently allocate shareholder capital ahead of the planned spinoff, including repurchasing $1.7 billion worth of stock.
In May, the company completed the sale of its personal protective equipment business for 1.3 billion US dollars.
In July, the company announced a review of strategic alternatives for its productivity solutions and services, as well as its warehouse and workflow solutions businesses.
In addition, Honeywell announced in May the acquisition of Johnson Matthey's catalyst technology business for £1.8 billion; in June, it completed the acquisition of Sundyne for $2.2 billion; and in July, it completed a strategic tuck-in acquisition of Li-ion Tamer.
With these latest transactions, Honeywell has announced $13.5 billion in acquisitions since December 2023, exceeding its commitment made at the 2023 Investor Day to deploy at least $25 billion by 2025 for high-return capital expenditures, dividends, opportunistic stock buybacks, and value-added acquisitions.
Performance of Various Business Segments
Despite the unpredictable macroeconomic environment, Honeywell's second-quarter performance was outstanding, with organic growth and adjusted earnings per share both exceeding expectations. Driven by the building automation business, three out of the four business segments achieved sales growth of over 5% this quarter.
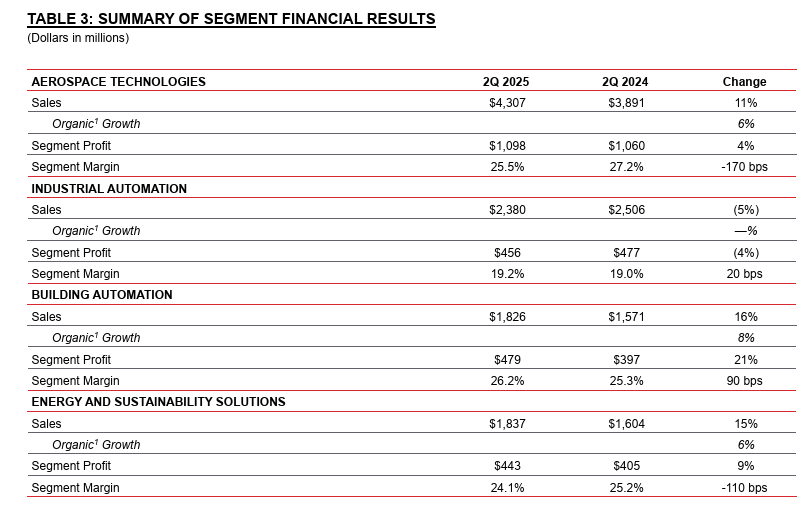
Aerospace technology business achieved an organic year-on-year growth of 6%, driven by continued strong growth in defense and space as well as the commercial aftermarket. Fueled by an enhanced global demand environment, the defense and space business saw a year-on-year increase of 13%. Commercial aftermarket sales grew by 7%, mainly due to the growth in air transport business and the ongoing unlocking of the supply chain.
Organic sales in industrial automation grew by 1%, remaining flat. Process solutions grew by 1% year-over-year, mainly due to a recovery in the smart energy business. Sales of sensing and safety technologies increased by 4% year-over-year, benefiting from continued growth in the medical sensor market, with the sensing business achieving growth for the third consecutive quarter. Sales of warehouse and workflow solutions declined by 4% year-over-year, due to poor scheduling of large project implementations. Sales of productivity solutions and services decreased by 7% year-over-year, primarily due to weak demand in the European market.
Building automation sales increased by 8% year-on-year, with building products growing by 9%. Fire safety, security, and building management systems performed strongly. Sales of building solutions grew by 5%, mainly driven by growth in the Middle East region.
In the second quarter, the sales of the Energy and Sustainable Development Solutions division increased by 6% year-on-year, with UOP growing by 16%, thanks to strong shipments of petrochemical catalysts, increased authorized sales of natural gas processing, and strong conversion of backlog orders for sustainable development projects. The sales of the Advanced Materials division grew by 1% this quarter, driven by the strong performance of specialty chemicals and materials, which was sufficient to offset the challenges faced by fluorine products in the first half of the year compared to the same period last year.
【Copyright and Disclaimer】The above information is collected and organized by PlastMatch. The copyright belongs to the original author. This article is reprinted for the purpose of providing more information, and it does not imply that PlastMatch endorses the views expressed in the article or guarantees its accuracy. If there are any errors in the source attribution or if your legitimate rights have been infringed, please contact us, and we will promptly correct or remove the content. If other media, websites, or individuals use the aforementioned content, they must clearly indicate the original source and origin of the work and assume legal responsibility on their own.
Most Popular
-

AI Computing Power Demand Ignites Electronic Fabrics! China Jushi Hits Limit Up! Domestic Substitution Welcomes Golden Window
-

Focus on going global! kingfa sci. leads, huitong, preter, and kumho nire follow, china’s modified plastics frenziedly expanding worldwide
-

Back-to-back major joker moves! covestro’s 1.32 million ton mdi dual-line expansion and hdi acquisition reshape global polyurethane landscape
-

Evonik Parts Ways With The Polyester Business! A Strategic Retreat By A Germany Chemical Giant And The Global Industry Shift
-

PA66 Cost and Profit: Broad-Based Weakness in the Feedstock Market Continues to Erode Cost Support for PA66 (202606)


