


European Chemical Industry Faces Upstream and Downstream Chain “Collapse”!
The European chemical industry holds an important position globally.The area is currently experiencing unprecedented cascading collapses.
The chemical production capacity in Europe is highly concentrated in the Northwestern European industrial corridor, with Germany forming the main industrial axis centered around the Rhine River region. In the lower reaches of the Rhine River, within the "chemical golden triangle" formed by Ludwigshafen, Leverkusen, and Frankfurt, there is a concentration ofBASF(The world's largest chemical company)
The giants contribute 78% of Germany's chemical production capacity and dominate the production of specialty chemicals, pharmaceutical intermediates, and high-performance materials.
Extending northwest to the Benelux Union, the Port of Antwerp (Belgium) and the Port of Rotterdam (Netherlands) are jointly constructed.The largest petrochemical hub in EuropeAntwerp, with an annual crude oil processing capacity of 180 million tons, has become the second-largest petrochemical cluster in Europe, while Rotterdam, leveraging its deep-water port advantage, has become an important base for companies such as LyondellBasell, focusing on the production of polyolefins and basic chemicals.
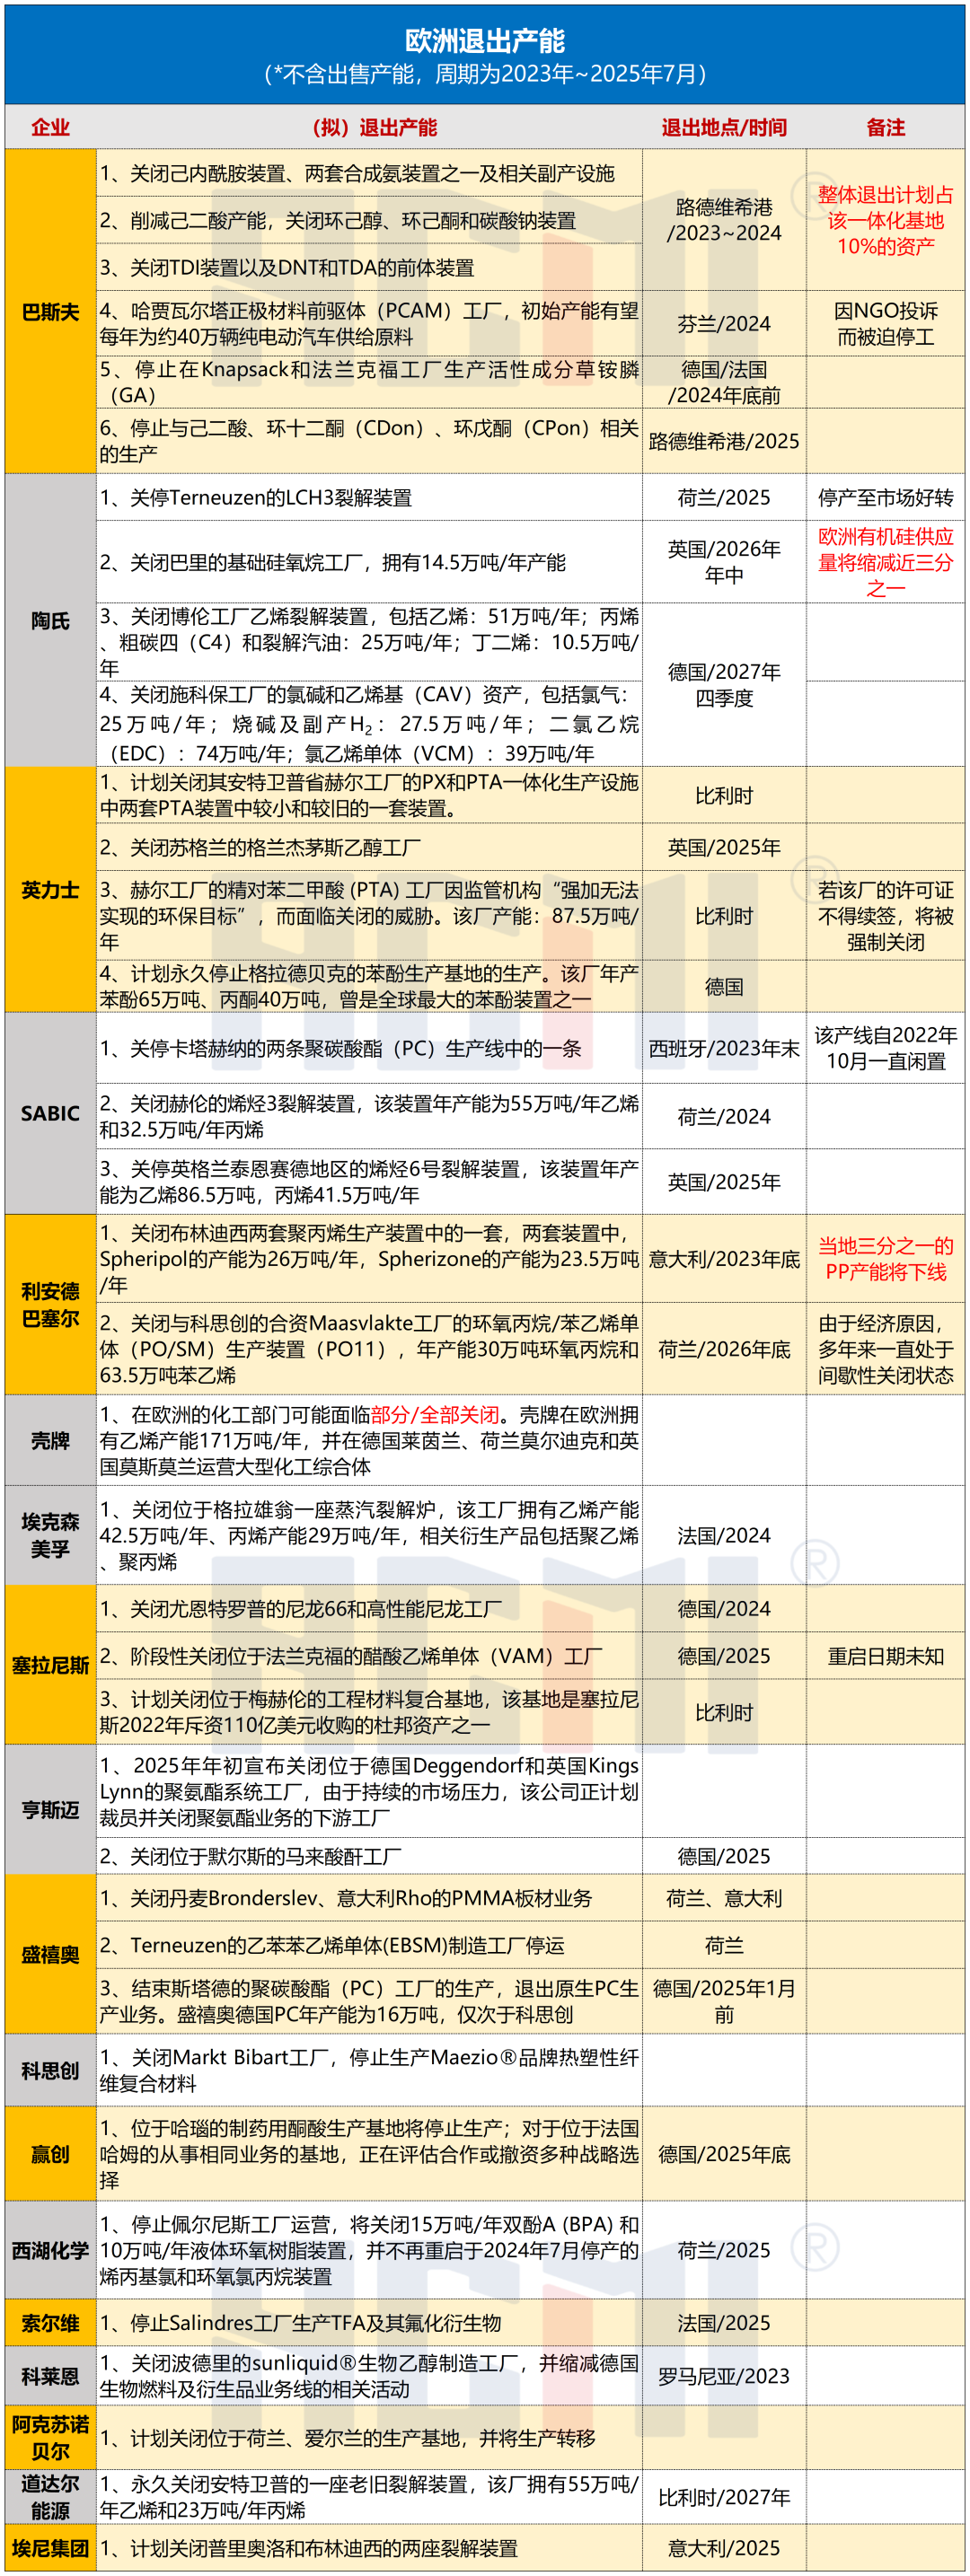
However, years of losses, high production costs, and aging equipment have gradually caused European companies to lose their competitiveness, making them increasingly dependent on imports for basic chemical raw materials such as ethylene and propylene. Taking cracking units as an example, several major players have shut down facilities one after another, toppling the entire industrial chain like dominoes. According to incomplete statistics and the current plans of major companies, the region may permanently withdraw about [amount missing] by the end of 2027.4.6 million tons/year of ethylene, 2.28 million tons/year of propylene, and 430,000 tons/year of butadiene production capacity.
Moreover, the crisis in the European chemical industry has gone beyond the shutdown of production capacity and is eroding its core competitiveness—the fine chemical service system. For example, after evaluation,HuntsmanIt has been found that the number of customers with demand for products and formulas provided by system vendors has decreased, and customers' willingness to pay has declined. This situation is particularly evident inEspecially common in EuropeAs a result, Huntsman made the decision to shut down two polyurethane plants.
In response to the current situation, the European Commission officially launched the "Action Plan for the Chemical Industry" on July 8, 2025, aiming to...Establish a European Key Chemicals Alliance, implement affordable energy actions, set up innovation-driven mechanisms, and reform regulatory systems.Address the threefold challenges of high energy costs, intensified global competition, and weak demand, while promoting industrial modernization and upgrading.
However, just one week after the policy was implemented, industry giant INEOS publicly voiced its concerns on July 15, pointing out fundamental flaws in the plan: "This belated scheme neither addresses the urgency of the industry's crisis nor offers any substantive solutions. For Europe's chemical industry, which is on the verge of collapse, these measures are nothing more than a drop in the ocean." Such sharp criticism reflects widespread skepticism within the industry regarding the effectiveness of the policy. Additionally, it is worth noting that a recent EU measure to impose retaliatory tariffs on US products totaling 93 billion euros may have a certain impact on local industrial development in the future. Taking Germany as an example, the US and Germany are mutually dependent in certain high-end manufacturing sectors. In the chemical products sector, including imported products such as diagnostic reagents, 15% come from the United States, with a total value of 2.9 billion euros. In the energy sector, Germany mainly imports crude oil and hard coal from the US, totaling 14.8 billion euros, accounting for 13.6%.
According to incomplete statistics,Since 2023, giants including BASF, Dow, Evonik, Huntsman, Celanese, INEOS, Covestro, SABIC, LyondellBasell, ExxonMobil, AkzoNobel, Shell, and TotalEnergies have been gradually "withdrawing" from Europe.:
【Copyright and Disclaimer】The above information is collected and organized by PlastMatch. The copyright belongs to the original author. This article is reprinted for the purpose of providing more information, and it does not imply that PlastMatch endorses the views expressed in the article or guarantees its accuracy. If there are any errors in the source attribution or if your legitimate rights have been infringed, please contact us, and we will promptly correct or remove the content. If other media, websites, or individuals use the aforementioned content, they must clearly indicate the original source and origin of the work and assume legal responsibility on their own.
Most Popular
-

AI Computing Power Demand Ignites Electronic Fabrics! China Jushi Hits Limit Up! Domestic Substitution Welcomes Golden Window
-

Focus on going global! kingfa sci. leads, huitong, preter, and kumho nire follow, china’s modified plastics frenziedly expanding worldwide
-

Back-to-back major joker moves! covestro’s 1.32 million ton mdi dual-line expansion and hdi acquisition reshape global polyurethane landscape
-

Evonik Parts Ways With The Polyester Business! A Strategic Retreat By A Germany Chemical Giant And The Global Industry Shift
-

PA66 Cost and Profit: Broad-Based Weakness in the Feedstock Market Continues to Erode Cost Support for PA66 (202606)


