


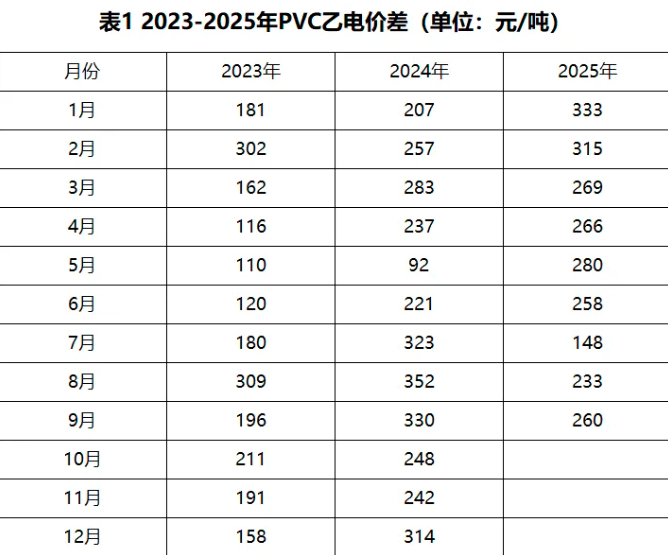
Ethylene Method and Calcium Carbide Method Price Gap Limited: Q4 PVC Trend Analysis
By the end of September 2025, the domestic monthly average price difference between ethylene-based and carbide-based PVC (hereafter referred to as "ethylene-carbide") remained in the range of 230-330 yuan/ton. Compared to data from the past three years, this year's price difference has generally increased compared to 2024, but it shows a clear trend of "gradual narrowing." The price difference reached the annual peak of 330 yuan/ton in January and quickly narrowed after mid-to-late July, even briefly inverting to -10 yuan/ton on July 25. This fluctuation trajectory is highly related to changes in the supply and demand pattern.
From the perspective of process characteristics, the ethylene method PVC maintains a price advantage due to lower VCM residuals and higher product application standards, with the caustic soda-ethylene price spread remaining stable at 150-330 RMB/ton over the past three years. However, the price spread fluctuations in 2025 will be more influenced by short-term supply and demand imbalances.
Core driver of spread volatility: phase transition of supply and demand pattern.
July 1-15: Supply discrepancies drive up price differences.
The price spread in January reached a yearly high of 400 yuan/ton, mainly due to the supply divergence between the calcium carbide process and the ethylene process. As the industry's leading process, the calcium carbide process has a high capacity ratio. During the Spring Festival, companies maintained high operating rates, resulting in abundant spot supply and inventory accumulation, while demand was subdued due to the holiday, putting downward pressure on calcium carbide prices. In contrast, ethylene process companies, with sufficient pre-sale orders and increased export orders, faced less inventory pressure, maintaining high prices, which widened the price gap between the two.
During this phase, although there are fluctuations in the price difference, it remains overall stable. Above 200 yuan/ton, the lowest value of 180 yuan/ton occurred on July 4, and there has not yet been a trend reversal.
Mid to late July: Supply and demand reversal leads to narrowing price spread.
Starting from mid to late July, the electricity price gap in Region B has entered a rapid narrowing phase, driven primarily by opposing changes on both the supply and demand sides.
Carbide Method Side: Policy and Supply Support Prices
In July, industry optimization policies drove commodity market prices upward, with futures delivery mainly consisting of calcium carbide materials, enhancing the linkage between spot and futures markets. Consequently, traders raised their quotations accordingly. Meanwhile, some calcium carbide method enterprises entered maintenance periods, leading to a decrease in capacity utilization rates, easing supply pressures, and causing the price center to continue to rise.
Ethylene method side: New capacity suppresses prices.
The second half of the year domestically Among the new PVC capacity of 1.7 million tons, 1.4 million tons is produced via the ethylene method, with Fujian Wanhua's 500,000 tons and Tianjin Bohua's 400,000 tons successfully put into operation. Market expectations for increased supply from the ethylene method are rising, coupled with weak demand for end products and insufficient domestic demand, putting pressure on traders' sales. The price increase for the ethylene method has lagged behind that of the calcium carbide method, leading to a rapid narrowing of the price gap.
It is worth noting that at this time the industry has already shown a comprehensive supply-demand imbalance. As of September 11, the average profit for carbide process enterprises was -502 yuan/ton, and for ethylene process enterprises was -672 yuan/ton. However, chlor-alkali enterprises rely on the model of "using alkali to compensate chlorine" to maintain high operating rates, further exacerbating supply pressure.
Q4 Outlook: Spreads Continue to Narrow, Prices Unlikely to Improve
Supply side: The pressure of capacity release from ethylene production intensifies.
According to the estimation of Specialized Plastic Vision,By the end of 2025, the domestic PVC total production capacity is expected to reach 29.72 million tons, an increase of 7.92% year-on-year. Among this, the newly added capacity of 1.7 million tons in the second half of the year will be fully released in the fourth quarter, with the ethylene method accounting for over 80%. The commissioning and production of facilities such as Qingdao Bay Chemical and Gansu Yaowang will further amplify the supply pressure from the ethylene method, making market competition inevitable.
Demand Side: Lackluster Peak Season Restricts Price Elasticity
The demand side is still difficult to find support. As a PVC is the largest downstream sector, and the real estate industry continues to be sluggish. From January to July, the construction area of houses decreased by 9.2% year-on-year, and the newly started construction area dropped by 19.4%, making it difficult to boost demand for rigid products. Although there is policy support in the automotive and home appliance sectors, and the lightweight trend of new energy vehicles is driving the demand for PVC compounds (it is expected that by 2025, the demand scale in the automotive sector will reach 40 billion yuan), it is difficult to offset the negative impact from the real estate sector. As of September 4, the operating rate of downstream sample enterprises for PVC was only 38.89%, a year-on-year decrease of 2.06 percentage points, indicating a clear weakness in demand.
Export end: Trade barriers weaken external demand pull.
The export market is also under pressure.In 2025, the global PVC supply and demand imbalance will worsen, with rising international trade protectionism. Markets such as India are imposing anti-dumping duties on imported PVC, causing domestic companies to slow down their export pace, making it difficult to achieve sustained growth. The weakening external demand further compresses the price upward potential of the ethylene method.
Price Spread and Price Prediction
In summary, the newly added ethylene production capacity in the fourth quarter will stabilize production, further highlighting the surplus supply situation, while the demand side remains unchanged. "The phenomenon of 'peak season not being prosperous' has become a foregone conclusion, intensifying competition among enterprises. Against this backdrop, it is difficult for ethylene-based prices to see a significant increase, and the price gap between ethylene and electricity is expected to continue to narrow. Meanwhile, due to mismatches in supply and demand, prices for both calcium carbide-based and ethylene-based PVC lack upward momentum and are likely to maintain a range-bound fluctuation pattern."
【Copyright and Disclaimer】This article is the property of PlastMatch. For business cooperation, media interviews, article reprints, or suggestions, please call the PlastMatch customer service hotline at +86-18030158354 or via email at service@zhuansushijie.com. The information and data provided by PlastMatch are for reference only and do not constitute direct advice for client decision-making. Any decisions made by clients based on such information and data, and all resulting direct or indirect losses and legal consequences, shall be borne by the clients themselves and are unrelated to PlastMatch. Unauthorized reprinting is strictly prohibited.
Most Popular
-

AI Computing Power Demand Ignites Electronic Fabrics! China Jushi Hits Limit Up! Domestic Substitution Welcomes Golden Window
-

Focus on going global! kingfa sci. leads, huitong, preter, and kumho nire follow, china’s modified plastics frenziedly expanding worldwide
-

PA66 Cost and Profit: Broad-Based Weakness in the Feedstock Market Continues to Erode Cost Support for PA66 (202606)
-

Back-to-back major joker moves! covestro’s 1.32 million ton mdi dual-line expansion and hdi acquisition reshape global polyurethane landscape
-

Evonik Parts Ways With The Polyester Business! A Strategic Retreat By A Germany Chemical Giant And The Global Industry Shift


