


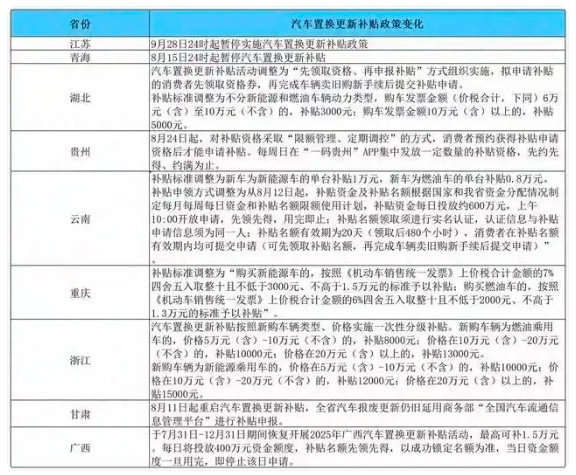
Ensure Funds Are Used Orderly! Multiple Regions Pause Automobile Trade-In Subsidy
During the observation on October 2nd by , it was found that during the double holidays, multiple regions such as Jiangsu, Ningbo, and Guangxi consecutively issued announcements to suspend the car replacement and update subsidies, causing widespread market attention. On the surface, it appears that the funding pool is running low.The "emergency braking" is actually the inevitable result of a multidimensional game between central and local governments, and between policy and market. Considering the 2025 car sales data and the trend of industrial upgrading, the demand for automotive plastics is undergoing a complex evolution of short-term pressure and long-term growth.
Source: Legal Daily
Mismatch in fund allocation: The underlying logic of the suspension of national subsidies
In 2025, the central government issued 300 billion yuan in special ultra-long-term government bonds in four batches to support the old-for-new initiative. Of this, 162 billion yuan had already been allocated in January and April, leaving the remaining 138 billion yuan to be distributed evenly on a quarterly basis. However, local implementation showed significant disparities: Chongqing received 3.1 billion yuan (including 100 million yuan in local matching funds) and disbursed over 1.6 billion yuan in subsidies in May alone, with the rate of fund consumption far exceeding expectations. In contrast, Tianjin adopted a "monthly balanced distribution" model, opening the coupon redemption portal at 10 a.m. each morning on a first-come, first-served basis. This "centralized central disbursement-local concentrated application" timing mismatch, combined with fraudulent subsidy claims such as "zero-mile second-hand cars," forced local governments to suspend policies to recalibrate fund usage efficiency. The National Development and Reform Commission has explicitly requested that "funds be used in an orderly and balanced manner until the end of the year," essentially aiming to achieve a balance between "stimulating consumption" and "avoiding overcapacity expansion" through policy calibration.
Sales data reveals the fragmentation of demand structure.
In the first half of 2025, passenger car retail sales reached 10.901 million units, a year-on-year increase of 10.8%, and the penetration rate of new energy vehicles reached 50.2%. However, the total retail sales of automobiles only saw a slight increase of 0.8%. Behind this contradictory data lies a structural shift in the demand for automotive plastics.
In the traditional fuel vehicle sector, including National IV and below fuel vehicles in subsidies may expand demand, but the technical threshold is raised (e.g., range).The withdrawal of subsidies for low-end models (such as the Hongguang MINI EV) due to a range of ≥400 kilometers has led to a slowdown in the growth of plastic demand for traditional fuel vehicles.
In the field of new energy vehicles, the surge in lightweight demand drives the increase in per vehicle plastic consumption. TeslaThe Model 3 doors are made of polycarbonate/acrylonitrile-butadiene-styrene copolymer (PC/ABS), which reduces weight by 30% compared to traditional steel doors. The battery pack of the BYD Han EV uses high-strength polypropylene (PP) material, reducing weight by 40% compared to metal enclosures. According to Polaris Market Research, the global automotive plastics market size is expected to grow from $42 billion in 2025 to $59.04 billion by 2032, with a compound annual growth rate of 7.5%, driven by more than 60% of the growth coming from new energy vehicles.
Challenges and Opportunities in the Automotive Plastics Industry
In the short term, the suspension of national subsidies has led to fluctuations in automotive end-user demand, and some car manufacturers have reduced production, resulting in a decrease in the procurement of automotive plastics. Taking the Yangtze River Delta region as an example,In the third quarter of 2025, the order volume for automotive modified plastics declined by 8% compared to the previous quarter, and the inventory turnover days for some small and medium-sized enterprises extended from 30 days to 45 days. However, in the long term, industrial upgrading will bring structural opportunities.
Material Innovation: High-strength polypropylene, high-temperature resistant nylon, bio-based polylactic acid.The development of new materials such as PLA is accelerating. For example, BASF's Ultradur® PBT material can withstand high temperatures up to 220℃ and has been applied in electric vehicle charging interfaces; Covestro's Maezio® continuous fiber-reinforced thermoplastic composite is 50% lighter than traditional metals and is suitable for battery pack supports in new energy vehicles.
Process Upgrade: Traditional processes such as injection molding and extrusion molding are transitioning to lightweight processes like micro-foaming injection molding and gas-assisted injection molding. For example, Changan Automobile uses micro-foaming injection molding technology to produce dashboards, achieving weight reduction compared to traditional processes.20%, cost reduction of 15%.
The suspension of national subsidies is essentially a phased adjustment of policy calibration and fund allocation, rather than simply a..."Stabilization" operation. In conjunction with the 2025 automotive sales data, the demand for automotive plastics is undergoing a structural transformation characterized by a slowdown in traditional fuel vehicle demand and a surge in new energy vehicle demand. In the short term, the industry faces challenges such as demand fluctuations and inventory pressure; in the long term, material innovation and process upgrades will open up new growth opportunities. The automotive industry and the plastics industry need to achieve sustainable development through technological innovation and industrial upgrading in the new market environment, ultimately seizing the initiative in the wave of electrification and intelligentization.
【Copyright and Disclaimer】This article is the property of PlastMatch. For business cooperation, media interviews, article reprints, or suggestions, please call the PlastMatch customer service hotline at +86-18030158354 or via email at service@zhuansushijie.com. The information and data provided by PlastMatch are for reference only and do not constitute direct advice for client decision-making. Any decisions made by clients based on such information and data, and all resulting direct or indirect losses and legal consequences, shall be borne by the clients themselves and are unrelated to PlastMatch. Unauthorized reprinting is strictly prohibited.
Most Popular
-

AI Computing Power Demand Ignites Electronic Fabrics! China Jushi Hits Limit Up! Domestic Substitution Welcomes Golden Window
-

Focus on going global! kingfa sci. leads, huitong, preter, and kumho nire follow, china’s modified plastics frenziedly expanding worldwide
-

Back-to-back major joker moves! covestro’s 1.32 million ton mdi dual-line expansion and hdi acquisition reshape global polyurethane landscape
-

Evonik Parts Ways With The Polyester Business! A Strategic Retreat By A Germany Chemical Giant And The Global Industry Shift
-

PA66 Cost and Profit: Broad-Based Weakness in the Feedstock Market Continues to Erode Cost Support for PA66 (202606)


