


Demand Remains Weak, Efficiency Takes the Lead—Analysis of United States (US) Transportation Fuel Consumption Trends and Oil Price Pressures
Conclusion:The U.S. transportation fuel market is undergoing profound structural changes, characterized by three major trends: slowing demand growth, improved energy efficiency, and fuel substitution. More than five years after the pandemic, demand for gasoline, distillate fuels, and aviation fuels has not returned to pre-pandemic levels, reflecting fundamental shifts in downstream consumption sectors. These changes not only impact short-term oil demand but also signal long-term structural transformations: accelerated substitution by biofuels and continued energy efficiency improvements suppressing oil demand growth.
Based on the analysis of the transportation fuel market and the assessment of the fundamentals of crude oil supply and demand, crude oil prices may exhibit a trend of high in the early part and low in the latter part in the second half of 2025. There is a potential for a temporary rebound in the third quarter, but the fourth quarter faces significant downward pressure.
The text above: Translate the above content into English and directly output the translation result without any explanation.
Since the outbreak of the COVID-19 pandemic in 2020, more than five years have passed. Although economic activities and personal travel have gradually resumed, the U.S. transportation fuel market has undergone significant changes. As of the first quarter of 2025, the demand for gasoline, distillate fuel oil, and aviation fuel in the United States has not returned to pre-pandemic levels (see chart below). This reflects the profound impact of improvements in energy efficiency, fuel substitution, and changes in the economic structure on transportation fuel consumption, indicating a fundamental shift in the demand structure for crude oil (see table below).
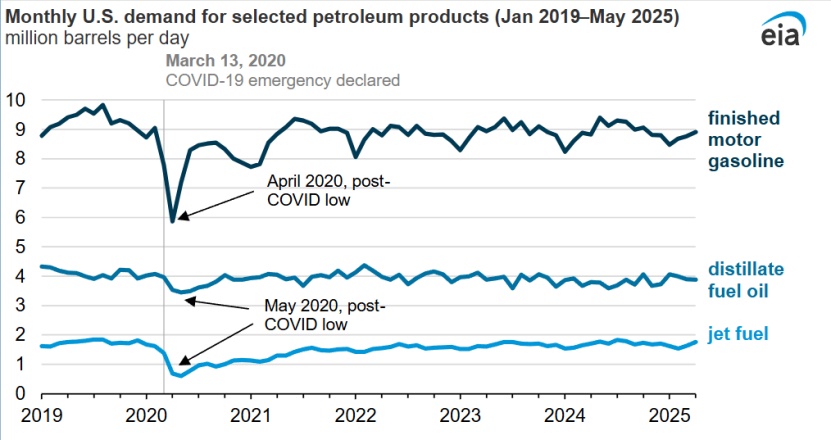
Table: Comparison of Major Transportation Fuel Demand in the United States (2019 vs. 2024)

In April 2020, the first month after the United States declared a national emergency due to the pandemic, U.S. gasoline demand plummeted to 5.9 million barrels per day, marking the lowest level since January 1974. By April 2025, U.S. gasoline demand gradually recovered to 8.9 million barrels per day, a 52% increase compared to April 2020, yet still below the April 2019 average level of 9.4 million barrels per day. Looking at annual data, U.S. gasoline demand averaged 9.3 million barrels per day from 2016 to 2019. After dropping to 8 million barrels per day in 2020, it rebounded to a plateau of 8.9 million barrels per day in both 2023 and 2024 (see chart below).
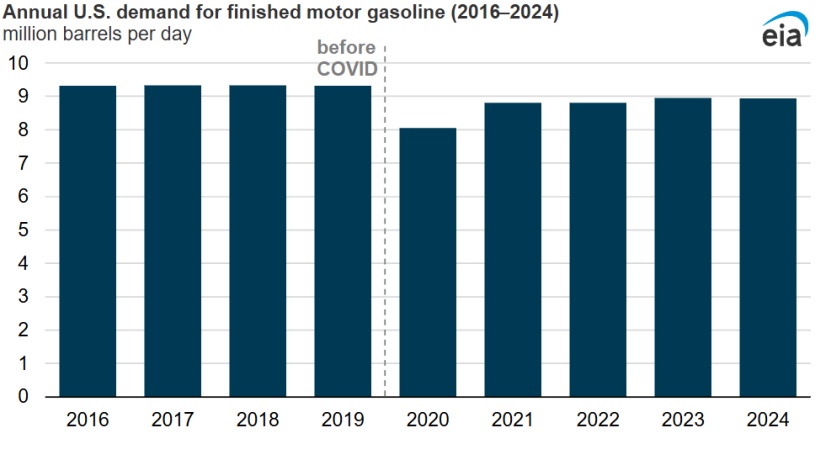
The main reason for the incomplete recovery of gasoline demand lies in the improvement of vehicle efficiency and the transition to electrification. Data shows that in 2024, the total vehicle miles traveled (VMT) in the United States will reach a record high of 9 billion miles per day, up from the average of 8.8 billion miles per day from 2016 to 2019. However, improvements in vehicle fuel economy and the increased adoption of electric vehicles have led to a situation where, despite the increase in miles traveled, gasoline consumption has not correspondingly increased. This "decoupling" phenomenon indicates that...Improving energy efficiency in the transportation sector has become a key factor in curbing crude oil demand.
The recovery path of aviation fuel demand is particularly tortuous. In May 2020, U.S. aviation fuel demand plummeted to 597,000 barrels per day, the lowest level since May 1968. By May 2025, demand is expected to recover to 1.8 million barrels per day, but it will still be below pre-pandemic levels. Although the number of passengers and available seat kilometers (a measure of an aircraft's carrying capacity) both increased in 2024 compared to 2019, the total number of flights decreased. Additionally, improvements in energy efficiency and changes in flight patterns have resulted in aviation fuel consumption remaining slightly below pre-pandemic levels (see the chart below).
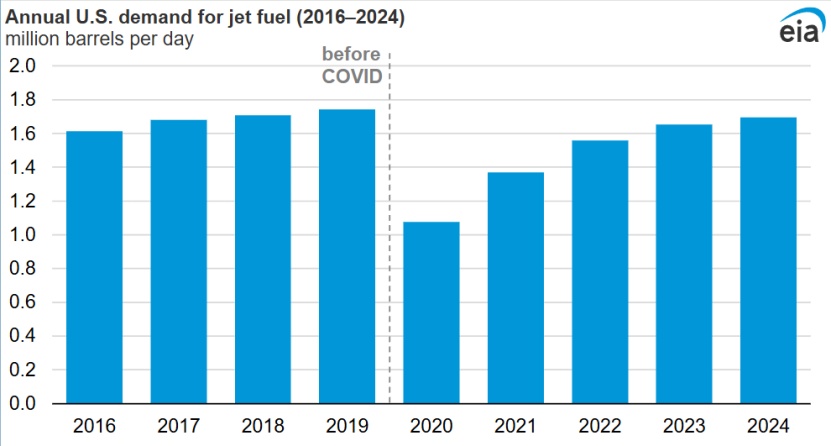
The U.S. Energy Information Administration (EIA) predicts that the growth in aviation fuel consumption will slow down in 2025 and expects this trend to continue into 2026. This slowdown in growth is lower than the accelerated growth rate of the previous four years and below the long-term growth rate of the 2010s. Factors influencing this trend include economic concerns exerting pressure on flight demand and the continuous improvement in fuel efficiency of commercial fleets. Data shows that the average fuel efficiency of U.S. airlines (available seat miles per gallon) has increased from 56 available seat miles per gallon in 2010 to 67 available seat miles per gallon in 2024, an improvement of 19%. As aircraft deliveries increase in 2025, this trend is expected to continue as more older models are replaced by newer, more efficient models.
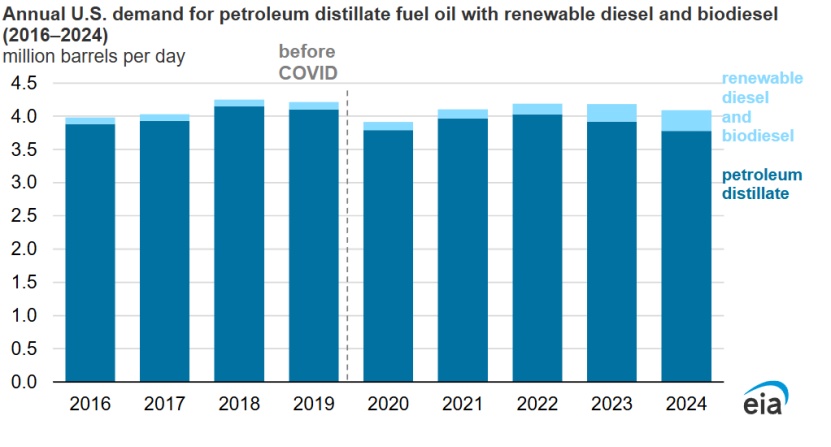
The demand pattern for distillate fuel oil (mainly including diesel and heating oil) differs from other transportation fuels. As distillate fuel oil is primarily used for freight transportation and economic activities, its consumption is less affected by pandemic lockdown measures compared to gasoline and aviation fuel. In May 2025, the demand for distillate fuel oil reached 3.8 million barrels per day, an increase of 10% (300,000 barrels per day) compared to the pandemic low in May 2020.
However, by 2024, the demand for distillate oil is expected to average 3.8 million barrels per day, still below the 4.1 million barrels per day level of 2019. This decline is mainly due to the substitution effect of biofuels on crude-based diesel. Data shows that in 2019, only 110,000 barrels per day of renewable diesel and biodiesel were consumed, but by 2024, this number has increased to 310,000 barrels per day (see the figure below).
Renewable diesel is primarily derived from animal and plant oils, and after processing, its chemical properties are identical to those of petroleum-based diesel. The West Coast of the United States is a leader in renewable diesel consumption, mainly due to the "clean fuel programs" implemented in California, Oregon, and Washington, which encourage its use.
Since the first quarter of 2023, renewable diesel consumption on the U.S. West Coast has approximately doubled, with most of the growth attributed to an increase in domestic production. By November 2024, the daily production of renewable diesel on the U.S. West Coast exceeded 90,000 barrels, nearly four times the production in the first quarter of 2023, accounting for about 45% of the region's renewable diesel consumption.
In California, renewable diesel accounted for nearly 65% of transportation fuel consumption in the third quarter of 2024, while biodiesel accounted for over 5%. In Oregon, biofuels made up about one-quarter of transportation fuel consumption in the third quarter of 2024, with renewable diesel comprising approximately twice the share of biodiesel. In Washington, biofuels accounted for about 20% of transportation fuel in the second quarter of 2024, with renewable diesel making up more than 15%. Renewable diesel production capacity is expected to grow by about 30% annually, reaching approximately 300,000 barrels per day by 2025.
One of the major challenges facing the strong growth of renewable diesel is the supply of raw materials, with the current primary feedstock for renewable diesel being soybeans. Early capacity expansion was driven by first-generation vegetable oil feedstocks used by biodiesel producers and the food production industry. From 2017 to 2023, the monthly consumption of soybean oil for biofuel production doubled; it is estimated that by 2024, the production of biofuels in the United States will account for more than 50% of all soybean oil consumption in the country. Feedstock may severely limit the growth potential of the renewable diesel market.
Based on the analysis of the current situation and future development trends of the U.S. transportation fuel market, we can predict the crude oil price trend for the fourth quarter of 2025. Multiple factors indicate that crude oil prices may face downward pressure in the second half of the year, but there will be a significant differentiation between different quarters.
From the supply side, the global crude oil market is facing pressure to increase production. With increased production from OPEC+, Brazil, Guyana, Norway, and other oil-producing countries and regions, there is significant long-term surplus pressure, making it difficult to refute inventory accumulation. The EIA predicts that due to increased inventories and production adjustments, global oil prices will plummet in the coming months, with Brent crude oil prices dropping from $71 per barrel in July to an average of $58 per barrel by the fourth quarter of 2025. This will be the lowest quarterly price for Brent crude oil since 2020.
From the demand side, the growth rate of demand in traditional major consumer countries such as the United States and China has slowed down, and even the total demand has contracted. While transportation fuel demand remains below pre-pandemic levels, improvements in energy efficiency and the substitution of fuels have further reduced crude oil demand. Although demand in some regions is marginally recovering or maintaining strong growth momentum, the overall situation on the demand side is stable, and the supply side will become the dominant factor in market trends.
Geopolitical risks and trade policies are significant uncertainties affecting oil prices. The Houthi attacks on commercial vessels in Yemen have rekindled concerns over disruptions to shipping in the Red Sea, but the uncertainty of Trump's tariff policies and OPEC+ production increases continue to limit oil price gains. It is expected that tensions in the Middle East will impact crude oil supply and lead to sudden price spikes.
Major institutions have some disagreements regarding oil price forecasts for the third and fourth quarters of 2025, but generally believe that oil prices will show a trend of high in the first half and low in the second half of the year. However, it is important to note that uncertainties such as the escalation of geopolitical risks or changes in OPEC+ production increase plans may significantly alter this forecast trajectory. Market participants need to pay more attention to the long-term trends and investment opportunities brought about by structural changes.
Author: Gao Xing, Senior Market Analysis Expert

【Copyright and Disclaimer】This article is the property of PlastMatch. For business cooperation, media interviews, article reprints, or suggestions, please call the PlastMatch customer service hotline at +86-18030158354 or via email at service@zhuansushijie.com. The information and data provided by PlastMatch are for reference only and do not constitute direct advice for client decision-making. Any decisions made by clients based on such information and data, and all resulting direct or indirect losses and legal consequences, shall be borne by the clients themselves and are unrelated to PlastMatch. Unauthorized reprinting is strictly prohibited.
Most Popular
-

AI Computing Power Demand Ignites Electronic Fabrics! China Jushi Hits Limit Up! Domestic Substitution Welcomes Golden Window
-

Focus on going global! kingfa sci. leads, huitong, preter, and kumho nire follow, china’s modified plastics frenziedly expanding worldwide
-

PA66 Cost and Profit: Broad-Based Weakness in the Feedstock Market Continues to Erode Cost Support for PA66 (202606)
-

Back-to-back major joker moves! covestro’s 1.32 million ton mdi dual-line expansion and hdi acquisition reshape global polyurethane landscape
-

Evonik Parts Ways With The Polyester Business! A Strategic Retreat By A Germany Chemical Giant And The Global Industry Shift


