


Crack spread peaks and retreats, pressure on crude oil to decline intensifies
The first half of 2025,The cracking spread in North America (represented by the United States) showsOverall fluctuating upwardThe trend reflects that the profit margin of refineries is gradually expanding.
1-7 Three main refined oil products(Gasoline, Diesel, Jet Fuel)The crack spreads have shown a significant increase, indicating continuous improvement in refining margins.I'm sorry, but you didn't provide an image or any content to translate. Please provide the text you would like translated into English.。
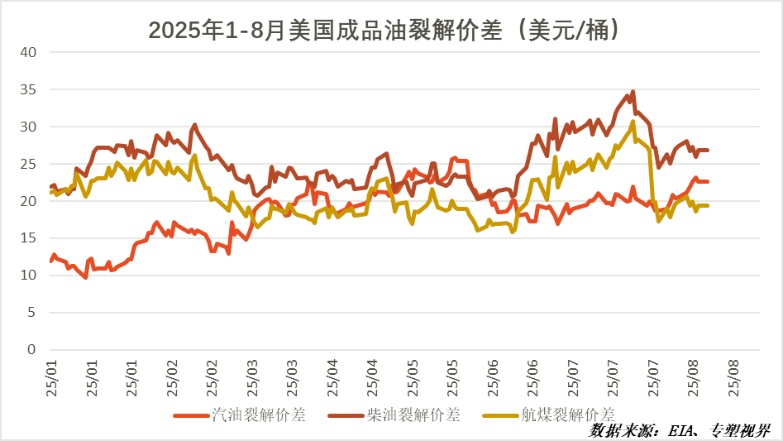
Among them,Diesel crack spread (dark red line) The greatest fluctuation indicates that diesel profits are the most sensitive to changes in market supply and demand.
Gasoline crack spread (red line) Steady upward movement,The trend is relatively stable, fully in line with the North American market.Seasonal patterns From the winter to the summer driving peak seasonSummerDrivingSeason) Demand analysisGradually increaseGasoline consumption increased, driving refining profits to reach the highest point of the year.
Jet fuel crack spread (yellow line) The trend is neutral.The above content translates to English as ",".The price level and volatility are between gasoline and diesel, reflecting the continued recovery and growth in demand for air travel.
North America's summer travel peakThe overall strengthening of the crack spreadMain driving force,Economic activity has also driven industrial and logistics sectors.Industry PairDemand for diesel and jet fuel.
Additionally,Refinery enters seasonal maintenance.At the time, May cause refined oil Stage appearanceNervous, lower refined oil This will exacerbate market concerns and drive up refined oil prices.,To expand the cracking spread.
Due to the change in crack spread being a leading indicator of crude oil demand, based on the recent significant decline from high levels in the crack spread, we expect...In the third and fourth quarters, international crude oil prices will face downward pressure, and the trend may be weak or fluctuate downward.
The transmission logic of crack spread (refining margin) contraction is as follows:
Faced with narrowing profits, the most direct response for refineries is to reduce processing volumes or undertake maintenance ahead of schedule. This means they will decrease crude oil purchases, directly weakening the demand for crude oil. If refinery processing volumes decline while crude oil supply remains stable, it may lead to an increase in crude oil inventories, thereby putting downward pressure on oil prices from a fundamental perspective.
The current crack spread of the three main refined oil products isAfter peaking in the early third quarter of 2025 (around July), there has been a significant decline, indicating that the momentum on the refined oil consumption side may be weakening, and the profit margins of refineries are being rapidly compressed.
Despite the bearish signal from crack spreads, crude oil prices are still influenced by the following key factors, which may alter the forecast path:
1. OPEC+ Policy: This is the biggest variable. If OPEC+ (especially Saudi Arabia and Russia) takes measures to extend or deepen production cuts, it will provide strong support for oil prices on the supply side, potentially offsetting the impact of weak demand.
2. Geopolitical Risks: Any geopolitical turmoil or supply disruptions in major global oil-producing regions (such as the Middle East, Russia) can lead to a short-term surge in oil prices.
Extreme Weather: If a North Atlantic hurricane hits the Gulf of Mexico, causing offshore oil platforms and coastal refineries to shut down, it will simultaneously affect crude oil supply and refined oil demand in the short term, resulting in complex price fluctuations.
Therefore, the judgment on the future trend of oil prices is as follows:
Baseline scenario (higher probability): In the absence of significant external interventions (such asIn the context of significant production cuts by OPEC+, given the refining margins indicating weaker refining profits and demand, it is difficult for international crude oil prices to maintain their strength in the third and fourth quarters. It is more likely that they will experience a volatile downward trend or a weak consolidation within a range.
Risk Scenario: IfOPEC+ has introduced stronger-than-expected production cuts, or significant geopolitical events may occur, which could support oil prices and keep them at high levels, or even push them higher again. However, even so, the weakness of the crack spread will limit the upside potential and sustainability of the oil price increase.
Author: Gao Xing, Senior Market Analyst

【Copyright and Disclaimer】This article is the property of PlastMatch. For business cooperation, media interviews, article reprints, or suggestions, please call the PlastMatch customer service hotline at +86-18030158354 or via email at service@zhuansushijie.com. The information and data provided by PlastMatch are for reference only and do not constitute direct advice for client decision-making. Any decisions made by clients based on such information and data, and all resulting direct or indirect losses and legal consequences, shall be borne by the clients themselves and are unrelated to PlastMatch. Unauthorized reprinting is strictly prohibited.
Most Popular
-

AI Computing Power Demand Ignites Electronic Fabrics! China Jushi Hits Limit Up! Domestic Substitution Welcomes Golden Window
-

Focus on going global! kingfa sci. leads, huitong, preter, and kumho nire follow, china’s modified plastics frenziedly expanding worldwide
-

Back-to-back major joker moves! covestro’s 1.32 million ton mdi dual-line expansion and hdi acquisition reshape global polyurethane landscape
-

Evonik Parts Ways With The Polyester Business! A Strategic Retreat By A Germany Chemical Giant And The Global Industry Shift
-

PA66 Cost and Profit: Broad-Based Weakness in the Feedstock Market Continues to Erode Cost Support for PA66 (202606)


