


Auto Market Rebounds! Latest CPCA Data: Average Daily Sales Reach 58,000, Soaring by 17%
On July 24, it was reported that the China Passenger Car Association (CPCA) recently released sales data for the third week of July (July 14, 2025 - July 20, 2025).
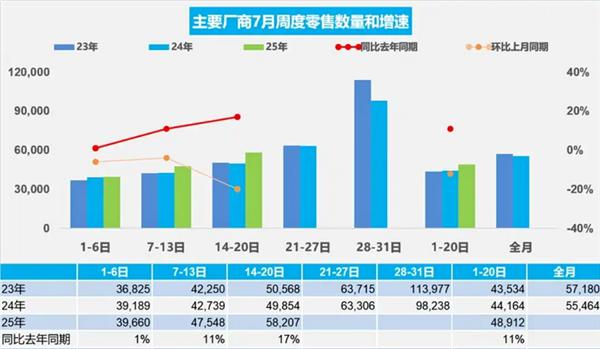
Data shows that from July 1 to 20, the national retail sales of passenger cars reached 978,000 units, an 11% increase compared to the same period in July last year, but a 12% decrease compared to the same period last month.
In the third week of July, the national passenger car market had an average daily retail sales of 58,000 vehicles, representing a 17% year-on-year increase compared to the same period in July last year, but a 20% decrease compared to the same period last month.
Since the beginning of this year, the domestic economic situation has been better than expected, especially with the improvement in exports over the past two months, which has stabilized the foundation of domestic demand.
There are 23 working days in July 2025, providing relatively ample time for production and sales. The structural differentiation in the automotive market’s growth is evident. Some companies have sufficient production capacity for traditional fuel vehicles, and inventory reduction is prominent under the pressure of a shrinking fuel vehicle market. It is expected that the summer high-temperature holiday will be relatively long, and the auto market will enter a period of adjustment in July.
In recent years, the characteristic of the summer car market being less sluggish has become increasingly evident. From 2014 to 2019, retail sales in July accounted for an average of 6.9% of the annual total, while from 2020 to 2024, July retail sales averaged 8.4% of the annual total, with the proportion in 2024 still reaching 7.5%.
From February 2025, the industry replacement rate has stabilized at over 60%, becoming the main driving force for the passenger car market, with the monthly patterns of the car market developing increasingly steadily.
From July 1st to 20th in the new energy vehicle sector, the national retail of new energy passenger vehicles reached 537,000 units, representing a 23% increase compared to the same period last year, and a 12% decrease compared to the previous month. The retail penetration rate of the national new energy passenger vehicle market was 54.9%. So far this year, the cumulative retail has reached 6.006 million units, marking a year-on-year growth of 32%.
From July 1 to 20, the wholesale volume of new energy passenger vehicles nationwide was 514,000 units, a 25% increase compared to the same period in July last year, and a 12% decrease compared to the same period last month. The penetration rate of wholesale new energy passenger vehicles nationwide was 53.6%. The cumulative wholesale volume for this year has reached 6.962 million units, a year-on-year increase of 36%.
Based on weekly data, the average daily retail sales of passenger cars in the first week of July nationwide was 40,000 units, representing a 1% year-on-year increase compared to the same period in July last year, and a 6% decrease compared to the same period last month.
In the second week of July, the national passenger car market had an average daily retail sales of 48,000 units, an 11% increase compared to the same period last year, and a 4% decrease compared to the same period last month.
The average daily retail sales of passenger cars nationwide in the third week of July reached 58,000 units, representing a 17% year-on-year increase compared to the same period in July last year, but a 20% decrease compared to the same period last month.
From July 1st to 20th, the national market retail sales reached 978,000 vehicles, representing an 11% increase compared to the same period last year, and a 12% decrease compared to the same period last month.
A total of 11.88 million retail units have been sold so far this year, representing a year-on-year increase of 11%.
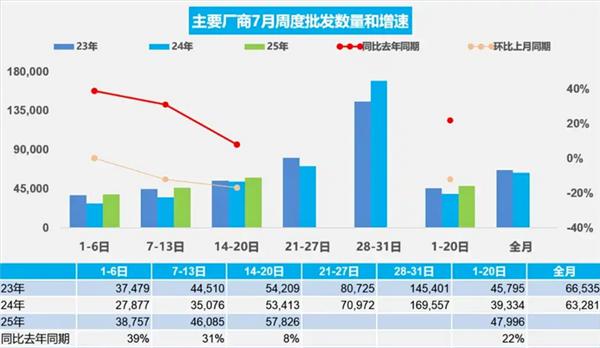
In terms of manufacturer wholesale, the daily average wholesale of passenger cars nationwide in the first week of July was 39,000 units, representing a 39% increase compared to the same period last year and a 0% growth compared to the same period last month.
In the second week of July, the average daily wholesale of passenger vehicles nationwide was 46,000 units, representing a 31% year-on-year increase compared to the same period last July, and a 12% decrease compared to the same period last month.
In the third week of July, the average daily wholesale volume of passenger vehicle manufacturers nationwide was 58,000 units, an 8% increase compared to the same period in July last year, but a 17% decrease compared to the same period last month. From July 1 to 20, nationwide passenger vehicle manufacturers wholesaled 960,000 units, a 22% increase year-on-year, but a 12% decrease compared to the same period last month.
Since the beginning of this year, a total of 14.24 million vehicles have been wholesaled, representing a year-on-year increase of 13%.
【Copyright and Disclaimer】The above information is collected and organized by PlastMatch. The copyright belongs to the original author. This article is reprinted for the purpose of providing more information, and it does not imply that PlastMatch endorses the views expressed in the article or guarantees its accuracy. If there are any errors in the source attribution or if your legitimate rights have been infringed, please contact us, and we will promptly correct or remove the content. If other media, websites, or individuals use the aforementioned content, they must clearly indicate the original source and origin of the work and assume legal responsibility on their own.
Most Popular
-

AI Computing Power Demand Ignites Electronic Fabrics! China Jushi Hits Limit Up! Domestic Substitution Welcomes Golden Window
-

Focus on going global! kingfa sci. leads, huitong, preter, and kumho nire follow, china’s modified plastics frenziedly expanding worldwide
-

PA66 Cost and Profit: Broad-Based Weakness in the Feedstock Market Continues to Erode Cost Support for PA66 (202606)
-

Back-to-back major joker moves! covestro’s 1.32 million ton mdi dual-line expansion and hdi acquisition reshape global polyurethane landscape
-

Evonik Parts Ways With The Polyester Business! A Strategic Retreat By A Germany Chemical Giant And The Global Industry Shift


