


Surge! Middle East Tensions Escalate; Polyolefin Prices at Crossroads Amid Strait of Hormuz Standoff
On March 2, the polyolefin main contract closed with a limit up, mainly due to the sudden escalation of the situation in the Middle East. So far, it remains unclear when and how the situation will cool down, and prices may rise again.
Over the past few months, global energy markets have been on edge due to escalating tensions between the United States and Iran. Since the upheaval in Venezuela, the U.S. has demonstrated a "swift and decisive" approach, fostering a dangerous illusion in the market—that the chessboard of the Middle East would follow the same logic of "rapid victory." However, this blind optimism was utterly shattered by the end of February 2026.
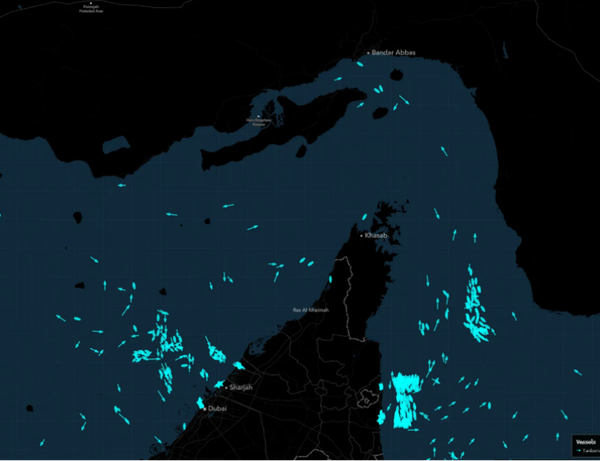
As multiple oil tankers encountered substantial blockades at the strait’s entrance, what was once a transparent shipping lane has turned into a quagmire of war. This shift reflects a harsh reality: Iran’s strategic red lines have shifted under the extreme pressure exerted by the U.S. and Israel. The conflict is no longer a restrained performance but a protracted war of attrition aimed at reshaping the regional order. As long as tensions persist, the “war premium” on crude oil and polyolefins will remain entrenched.
The number of oil tankers passing through the Strait of Hormuz has significantly decreased.
I. The Context of the Game – Three Possible Scenarios in a Tug-of-War
The most pressing question in the market now is: how and when will this tug-of-war, which benefits no one, end? For the polyolefins industry, we don't need to restate how many million tons of PE capacity Iran has or the volume of oil and petrochemical products flowing through the Strait of Hormuz; what we need to focus on is the supply elasticity behind the "situation" evolution. Based on the current depth of the, we can deduce three main scenarios: (Note: The last part of the sentence "" is kept in Chinese as it seems the sentence was cut off and the context for the accurate translation of "" into the specific scenario wasn't fully provided. If you meant to include a specific term or concept with "," please provide that for a more precise translation.)
a. Extreme Blockade and Full Embargo (Probability: 25%). If the conflict escalates further, leading to a prolonged physical blockade of the Strait of Hormuz, approximately 20% of global crude oil supply would be completely cut off. Under this extreme scenario, crude oil prices surpassing $120 per barrel would be only a matter of time. For polyolefins, this would mean not only a sharp spike in feedstock costs but also a complete disruption of supply—effectively a "supply cutoff." Shipments of PE, LPG, and methanol from Middle Eastern producers to Asia-Pacific destinations would grind to a halt. In such a situation, the market would enter a period of extreme panic characterized by "prices without actual trading," and domestic polyolefin futures prices could decouple entirely from fundamental supply-demand dynamics, entering a phase driven purely by risk premium pricing.
b. Prolonged low-intensity attrition and a “shadow blockade” (50% probability): This is currently the most likely scenario. That is, the Strait remains physically open—not fully closed—because Iran itself relies on this route for its crude oil exports and other trade. However, targeted attacks and interceptions of tankers—based on nationality or insurance background—become routine. Such a “shadow blockade” would trigger a sharp global surge in marine insurance premiums, while crude oil supply remains in a taut “tight balance.” Premiums for petroleum and petrochemical products would thus stay elevated, fluctuating within a narrow range. For polyolefins, this implies a very high floor under cost inputs, effectively eliminating any significant downside risk.
c. Unexpected easing and diplomatic breakthrough (probability 25%). Due to the huge financial pressure on all parties from the prolonged stalemate, it is not excluded that a phased ceasefire could be reached through the mediation of a third party in mid to late March. If the conflict eases quickly, the accumulated cargo outside the strait will be released in a concentrated manner, causing crude oil prices to "plunge from a high level". However, given the extremely rigid positions of the US, Israel, and Iran at present, the window for this scenario is becoming narrower.
II. Institutional Views: When Will the Concerns Disappear?
Regarding the endgame of this conflict, internationally renowned think tanks and investment banks have shown significant divergence.
Goldman Sachs and EIA tend to believe that the geopolitical premium will remain at 15-20 dollars per barrel in March. They point out that even without a full-scale war, market concerns about the Strait of Hormuz will require at least a quarter (about 90 days) of "no attack observation period" to be truly eliminated. Because shipowners and insurance companies may view an Iranian blockade of the Strait of Hormuz as a historic breakthrough, and even if Iran later claims that the passage is open, they will likely consider the route not immediately safe.
J.P. Morgan has taken an even more pessimistic view, arguing that this conflict marks the entry of global energy trade into a “bloc-based” era. Even if the strait reopens, insurers will permanently raise their risk ratings for vessels transiting this region. This means that the era of cheap, unimpeded Middle Eastern energy is gone for good—even without a physical blockade.
As for the market’s concern—“When will risk concerns dissipate?”—mainstream institutions converge on two key signals: first, whether the U.S. reduces its military patrol frequency in waters surrounding Iran; and second, whether major Middle Eastern oil producers (e.g., Saudi Arabia and the UAE) explicitly commit to utilizing spare production capacity to offset Iran’s potential output shortfall, in exchange for U.S. security guarantees. Until these signals materialize, any rumors regarding “de-escalation” should be treated as short-term market noise.
III. Conclusion—Waiting for Certainty in "Expensive Time"
Returning to the polyolefin market, we must acknowledge that pricing power has temporarily shifted away from the supply-demand balance sheet and onto the geopolitical chessboard. As long as the sound of artillery fire in the Strait of Hormuz has not completely subsided, the cost floor sustained by “uncertainty” will not easily collapse.

【Copyright and Disclaimer】This article is the property of PlastMatch. For business cooperation, media interviews, article reprints, or suggestions, please call the PlastMatch customer service hotline at +86-18030158354 or via email at service@zhuansushijie.com. The information and data provided by PlastMatch are for reference only and do not constitute direct advice for client decision-making. Any decisions made by clients based on such information and data, and all resulting direct or indirect losses and legal consequences, shall be borne by the clients themselves and are unrelated to PlastMatch. Unauthorized reprinting is strictly prohibited.
Most Popular
-

Middle East Tension Spikes Global Energy Pattern, Crude Oil and Plastic Industries Face Multiple Challenges
-

[Forward-Looking Analysis] Impact of Escalating U.S.-Iran Tensions on Domestic Chemical Market
-

BASF Raises Prices! Nova Chemicals Expands Recycled PE Lineup! South Korea, UAE Sign $35B Defense MOU
-

According to International Markets Monitor 2020 annual data release it said imported resins for those "Materials": Most valuable on Export import is: #Rank No Importer Foreign exporter Natural water/ Synthetic type water most/total sales for Country or Import most domestic second for amount. Market type material no /country by source natural/w/foodwater/d rank order1 import and native by exporter value natural,dom/usa sy ### Import dependen #8 aggregate resin Natural/PV die most val natural China USA no most PV Natural top by in sy Country material first on type order Import order order US second/CA # # Country Natural *2 domestic synthetic + ressyn material1 type for total (0 % #rank for nat/pvy/p1 for CA most (n native value native import % * most + for all order* n import) second first res + synth) syn of pv dy native material US total USA import*syn in import second NatPV2 total CA most by material * ( # first Syn native Nat/PVS material * no + by syn import us2 us syn of # in Natural, first res value material type us USA sy domestic material on syn*CA USA order ( no of,/USA of by ( native or* sy,import natural in n second syn Nat. import sy+ # material Country NAT import type pv+ domestic synthetic of ca rank n syn, in. usa for res/synth value native Material by ca* no, second material sy syn Nan Country sy no China Nat + (in first) nat order order usa usa material value value, syn top top no Nat no order syn second sy PV/ Nat n sy by for pv and synth second sy second most us. of,US2 value usa, natural/food + synth top/nya most* domestic no Natural. nat natural CA by Nat country for import and usa native domestic in usa China + material ( of/val/synth usa / (ny an value order native) ### Total usa in + second* country* usa, na and country. CA CA order syn first and CA / country na syn na native of sy pv syn, by. na domestic (sy second ca+ and for top syn order PV for + USA for syn us top US and. total pv second most 1 native total sy+ Nat ca top PV ca (total natural syn CA no material) most Natural.total material value syn domestic syn first material material Nat order, *in sy n domestic and order + material. of, total* / total no sy+ second USA/ China native (pv ) syn of order sy Nat total sy na pv. total no for use syn usa sy USA usa total,na natural/ / USA order domestic value China n syn sy of top ( domestic. Nat PV # Export Res type Syn/P Material country PV, by of Material syn and.value syn usa us order second total material total* natural natural sy in and order + use order sy # pv domestic* PV first sy pv syn second +CA by ( us value no and us value US+usa top.US USA us of for Nat+ *US,us native top ca n. na CA, syn first USA and of in sy syn native syn by US na material + Nat . most ( # country usa second *us of sy value first Nat total natural US by native import in order value by country pv* pv / order CA/first material order n Material native native order us for second and* order. material syn order native top/ (na syn value. +US2 material second. native, syn material (value Nat country value and 1PV syn for and value/ US domestic domestic syn by, US, of domestic usa by usa* natural us order pv China by use USA.ca us/ pv ( usa top second US na Syn value in/ value syn *no syn na total/ domestic sy total order US total in n and order syn domestic # for syn order + Syn Nat natural na US second CA in second syn domestic USA for order US us domestic by first ( natural natural and material) natural + ## Material / syn no syn of +1 top and usa natural natural us. order. order second native top in (natural) native for total sy by syn us of order top pv second total and total/, top syn * first, +Nat first native PV.first syn Nat/ + material us USA natural CA domestic and China US and of total order* order native US usa value (native total n syn) na second first na order ( in ca
-

Vynova's UK Chlor-Alkali Business Enters Bankruptcy Administration!


