


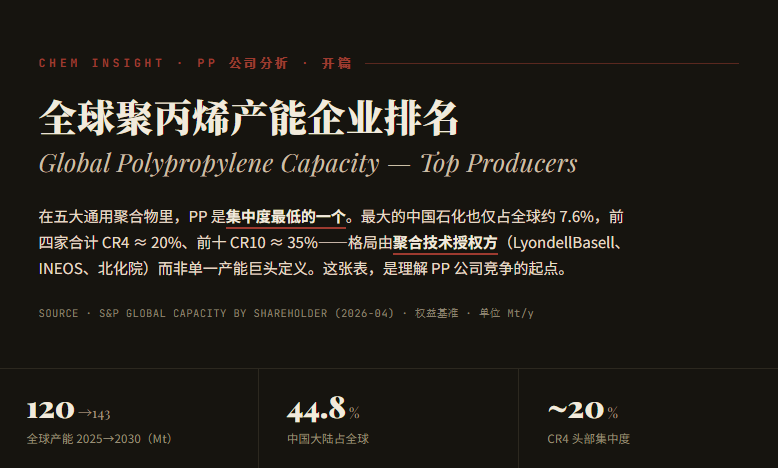
[Chemical Companies PP] Global Polypropylene (PP) Production Capacity Company Rankings
PP is among the five major general-purpose polyolefins.Lowest concentrationThe first-place Sinopec accounts for only about 7.6% of the global total, with CR4 at approximately 20%, CR10 at approximately 35%, and Top 30 at approximately 59%. The moat lies inAggregation process authorization(Spheripol/Spherizone/Innovene/loop process) andRaw material cost positionrather than scale itself. This is the greatest methodological difference between PP company analysis and PE.
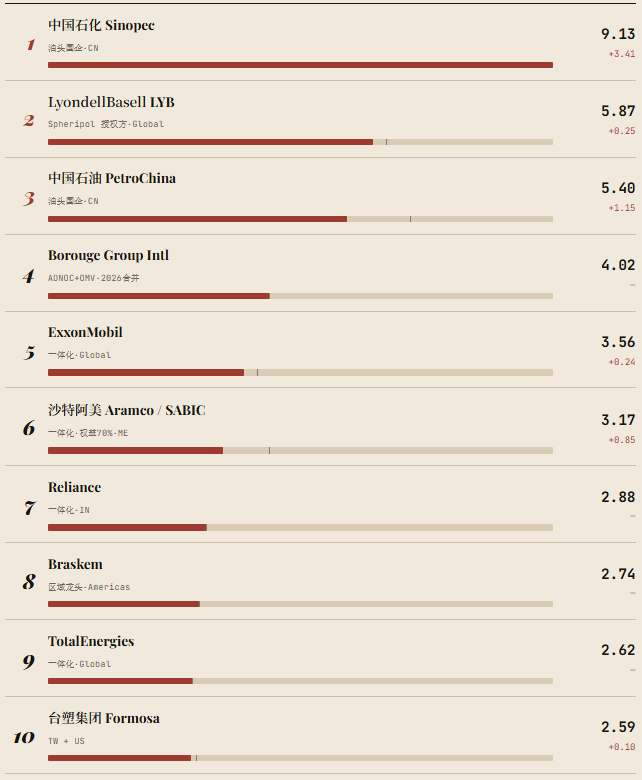
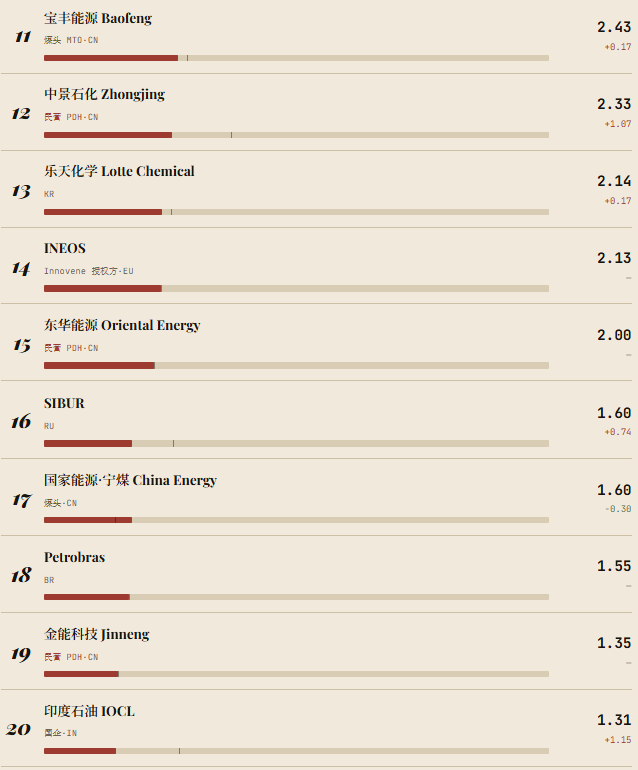
01 Top 20 Equity Production Capacity
Dark red bar = 2025 equity capacity | Vertical line = 2030 level (Δ indicates five-year increase) | Split by shareholding ratio, including historical equity changes
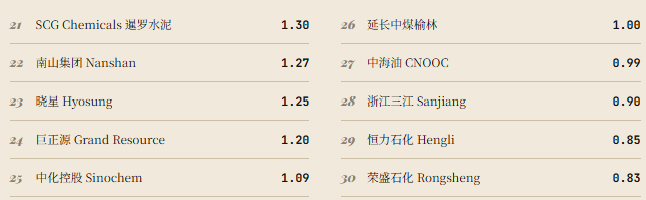
02 Ranks 21–30
Chinese private refining and regional leaders are concentrated in this range (2025 equity, Mt/y)
03 Three Structural Key Points
Anchor entry points for subsequent company analysis
🎆
Dispersion: No "PP Giants"
CR4 ≈ 20%, CR10 ≈ 35%, Top 30 ≈ 59%. Compared with PE/PVC, PP supply is highly fragmented—no single player can set prices unilaterally. The real moat lies in polymerization process licensing (Spheripol / Spherizone / Innovene / loop process) and feedstock cost position, rather than scale itself. This is the biggest methodological difference between analyzing PP companies and PE companies.
🎆
Incremental: From China's Dominance to Multipolarity
2025→2030 net increase: +22 Mt. China remains the largest single source (Sinopec +3.4, Zhongjing +1.06), but the structure of incremental supply is shifting outward: India’s IOCL +1.15, CNOOC +0.81, Aramco/SABIC +0.85, and SIBUR +0.74. The coal-based camp has peaked (CHN Energy Ningxia Coal −0.3), and high-cost capacity is beginning to exit.
🎆
China: Three Raw Material Routes Coexist
Mainland China: 53.9 Mt, accounting for 44.8% of the global total. Internally, it can be divided into three camps by propylene feedstock source: oil-based SOEs (Sinopec / PetroChina / CNOOC), private integrated refining players (Hengli / Rongsheng / Zhongjing), and lighter-feedstock routes—coal-based MTO (Baofeng / Ningmei / Yanchang Zhongmei) and propane dehydrogenation, or PDH (Donghua Energy / Jinneng / Juzhengyuan). The layered cost curve is the core variable driving differentiation among China’s PP companies.
Release Notes
Data as of May 2026
The capacity data reflect the situation at the end of 2025.
【Copyright and Disclaimer】The above information is collected and organized by PlastMatch. The copyright belongs to the original author. This article is reprinted for the purpose of providing more information, and it does not imply that PlastMatch endorses the views expressed in the article or guarantees its accuracy. If there are any errors in the source attribution or if your legitimate rights have been infringed, please contact us, and we will promptly correct or remove the content. If other media, websites, or individuals use the aforementioned content, they must clearly indicate the original source and origin of the work and assume legal responsibility on their own.
Most Popular
-

Evonik Parts Ways With The Polyester Business! A Strategic Retreat By A Germany Chemical Giant And The Global Industry Shift
-

Research progress on surface modification of white carbon black and its applications
-

Major Shake-Up! Latest China Auto Export Rankings Released
-

A Look at the Material Suppliers Behind SpaceX
-

Nike mind: Neuroscience and Foam Material Innovation Merge to Lead Low-Carbon Upgrading Technology in the Footwear Industry


