


Major Shake-Up! Latest China Auto Export Rankings Released
According to statistics from the China Association of Automobile Manufacturers, this yearFirst half of the yearNational Automobile Sales 15.653 million vehicles, a year-on-year increase of 11%.4Sales of new energy vehicles reached 6.937 million units, a year-on-year increase of 40.3%, accounting for 44.3% of the total new car sales.。At the same timeChinese automobile companies are accelerating their expansion overseas, injecting new momentum into the global automotive industry landscape through technological innovation and localization strategies.In the first half of the year, China's automobile exports3.083 million vehicles were sold, a year-on-year increase of 10.4%. Among them, the export of new energy vehicles grew rapidly, reaching 1.06 million units, a year-on-year increase of 75.2%.
According to the statistics from Yiche,In the first half of 2025, the top three destinations for China's automobile exports were Mexico, the United Arab Emirates, and Russia, with export volumes of 234,500 vehicles, 214,300 vehicles, and 171,000 vehicles, respectively.Mexico grew by 30.7% year-on-year, the UAE grew by 58.5% year-on-year, while Russia plummeted by 59.2%.
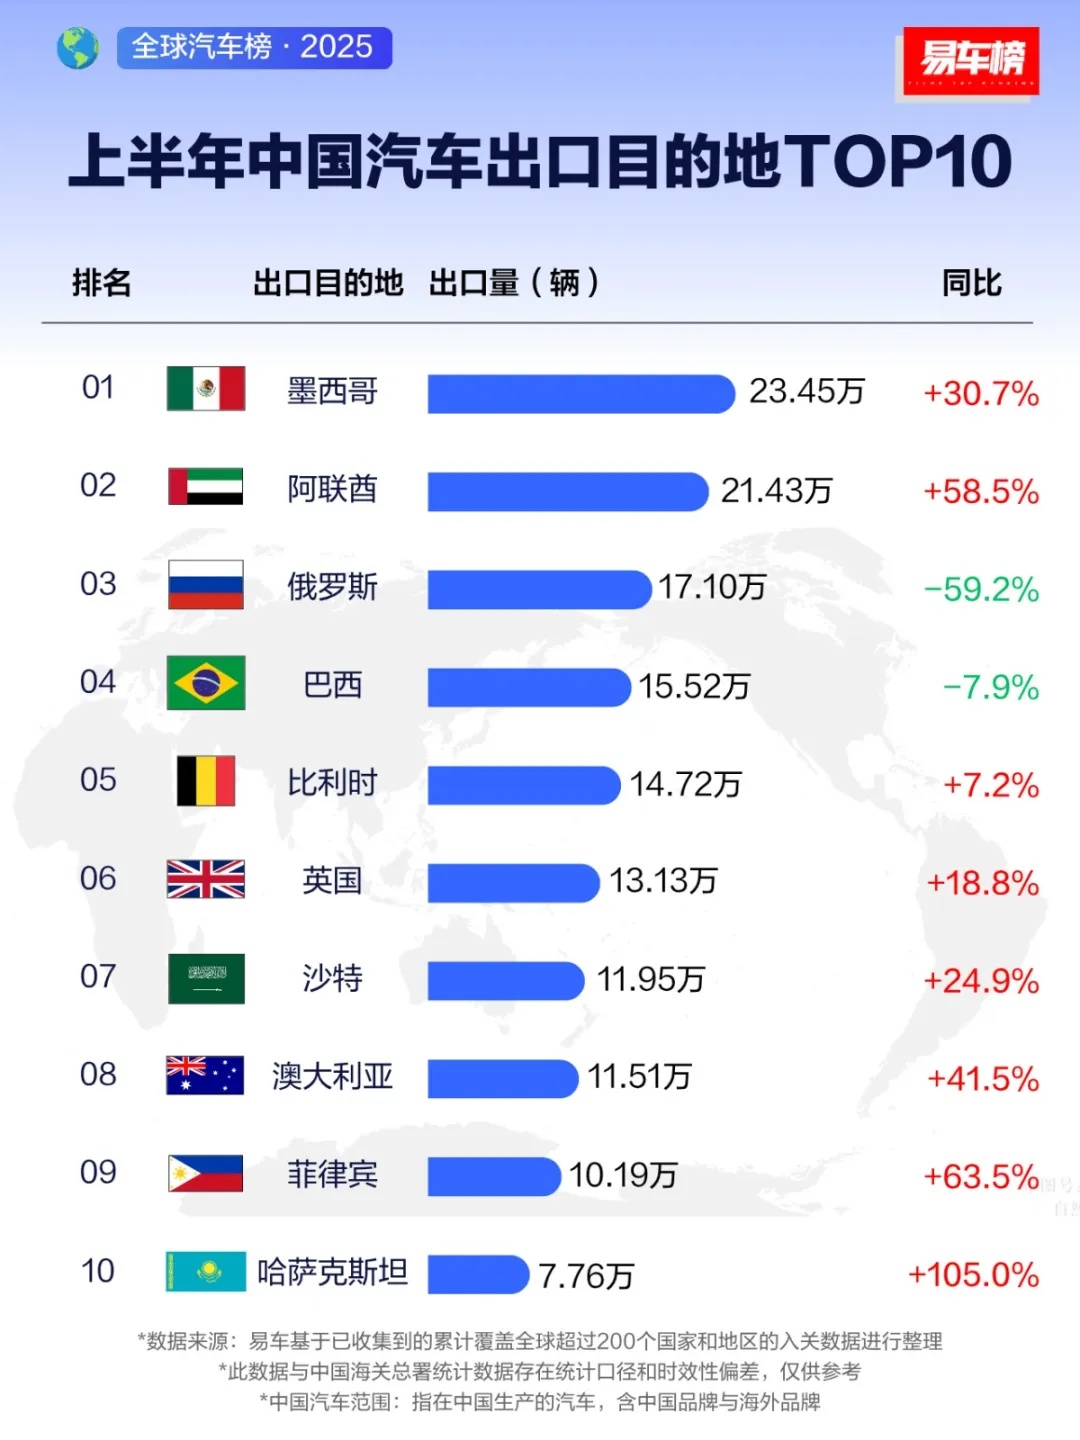
Mexico has become China's number one automobile export country, mainly because of BYD.In Mexico, demand has increased significantly, with main models such as Seagull and Song PLUS DM-i already launched in the market. The rapid sales growth in the UAE is mainly because the UAE serves as a distribution hub for car imports in the Middle East. Since the beginning of this year, Geely's exports to Middle Eastern markets such as Saudi Arabia and the UAE have increased, driving up overall import volumes. As for Russia, it is the country with the largest decline on the list, with a drop of 59.2%. Analysts have pointed out that this is due to two reasons: first, Russia raised car loan interest rates and vehicle import scrappage taxes this year, increasing the cost of purchasing cars for local consumers and causing terminal sales to decline; second, Chinese automakers had relatively high inventory levels in Russia previously, leading to a sales bottleneck this year.
Among other countries, the fourth to tenth places on the list are Brazil, Belgium, the United Kingdom, Saudi Arabia, Australia, the Philippines, and Kazakhstan, among which Brazil declined by 7.9% year-on-year.Kazakhstan is the country with the largest increase on the list, with a year-on-year growth of 105.0%.
Let's take another look at the car companies.Chery Automobile by54.49With sales reaching ten thousand units, it firmly holds the number one position, but compared to the same period last year...Growth 3.5Export has always been Chery’s strength. As a “veteran” in Chinese automobile exports, Chery has cultivated overseas markets for many years, establishing a comprehensive sales network and production bases. Especially in regions such as Russia, the Middle East, and Latin America, Chery vehicles are well received by local consumers. In addition, in response to uncertainties in the global trade environment, Chery has accelerated the localization of its overseas production, effectively avoiding tariff barriers.

BYD follows closely behind.First half of the yearCumulative exports44.3110,000 vehicles, year-on-year growth118.2%, is the largest growth among the top ten car companies. With its advantages in core technologies such as batteries, motors, and electronic controls, BYD has launched a series of models that are popular with overseas consumers. In addition, BYD actively promotes localized production and self-operated shipping, effectively addressing high tariff barriers in regions such as Europe and the United States, further enhancing its competitiveness in overseas markets.

SAIC Motor Passenger Vehicle Company24.26Ranked third with a year-on-year decline in tens of thousands of units4.1The decline in export volume may be related to intensified competition in certain markets and supply chain instability. The main brand of SAIC passenger vehicle exports is MG. Although export volume has declined, the MG brand has performed well in regions such as Europe, Southeast Asia, and India. SAIC's deepened reforms have yielded significant results, with independent brands and new energy vehicles becoming the main drivers of growth. Moreover, SAIC has been committed to technological innovation and product upgrades, and is expected to regain growth momentum in overseas markets in the future.
The export volume in the first half of the year was 182,000 vehicles, a year-on-year increase of 7.4%.Through a series of overseas acquisitions and strategic collaborations, Geely has rapidly enhanced its brand’s international influence. Its brands, such as Volvo and Lynk & Co, have performed exceptionally well in the European market. In particular, Lynk & Co has successfully attracted the attention of young European consumers with its unique design, advanced technology, and premium positioning. In addition, Geely is actively expanding its presence in regions such as Southeast Asia and the Middle East, continuously broadening its overseas market footprint. Through localized production and marketing, Geely Automobile is better able to meet the needs of local consumers and drive the growth of its export business.

In addition,Great Wall Motors export16.7610,000 vehicles, a year-on-year decrease5.5%。Changan Automobile Export14.69Ten thousand vehicles, year-on-yeardown by 3.9% SAIC-GM-Wuling Export11.190,000 units, a year-on-year increase20.0%。
Tesla China Export10.11ten thousand units, a year-on-year decline31.9Tesla, although a globally renowned new energy vehicle brand, has experienced a significant decline in its export performance. This may be related to the intensified competition in the Chinese new energy vehicle market, changes in policies in some overseas markets, and a series of political actions by Musk.

In the rankings,Jiangsu Yueda Kia exports8.580,000 vehicles, a year-on-year increase of 2%0.6As a joint venture brand, although Yueda Kia's performance in the domestic market is average, it has found a new growth point through domestic production and export. In recent years, with the rise of Chinese independent automobile brands and the rapid development of the global new energy vehicle market, joint venture brands are facing increasing challenges in overseas markets. Jiangsu Yueda Kia needs to accelerate product updates and upgrades, enhance technical standards to adapt to market changes, and revitalize its export business.In addition, Beijing Hyundai has also begun exporting, with exports reaching 34,800 units in the first half of the year, a year-on-year increase of 248.4%, making it the automaker with the highest growth rate on the list.

From the rankings, it is not difficult to see that Chinese independent brands are increasingly gaining an advantage in exports. Among the top ten rankings, except for Tesla and Yueda Kia, all are independent brands, with Chery Automobile and BYD leading by a large margin, especially BYD, which has shown significant year-on-year growth.118.2The content you provided seems to be incomplete, but based on the text, a possible translation could be: "%, becoming the export overseas with the greatest growth potential." Manufacturers, this is related to BYD's aggressive expansion into overseas markets. As for joint venture brands such as Yueda Kia and Beijing Hyundai, most of them have started exporting their products to overseas markets due to sales pressure in the domestic market.
The competition in the international automobile market is extremely fierce. Many well-known international car companies have long established their presence in the global market, possessing profound brand heritage, advanced technology, and comprehensive sales and service networks. Chinese automobile companies face enormous challenges if they want to stand out in such a market environment. Compared with international automakers, Chinese cars once had significant gaps in brand awareness, technological level, and product quality. However, in recent years, through continuous increases in R&D investment, enhancement of technological innovation capabilities, and optimization of product quality, the competitiveness of Chinese automobiles has been significantly improved. Today, Chinese new energy vehicles have taken the lead in battery technology, intelligent driving, and other fields, and are able to compete head-to-head with international car companies.
【Copyright and Disclaimer】The above information is collected and organized by PlastMatch. The copyright belongs to the original author. This article is reprinted for the purpose of providing more information, and it does not imply that PlastMatch endorses the views expressed in the article or guarantees its accuracy. If there are any errors in the source attribution or if your legitimate rights have been infringed, please contact us, and we will promptly correct or remove the content. If other media, websites, or individuals use the aforementioned content, they must clearly indicate the original source and origin of the work and assume legal responsibility on their own.
Most Popular
-

AI Computing Power Demand Ignites Electronic Fabrics! China Jushi Hits Limit Up! Domestic Substitution Welcomes Golden Window
-

Focus on going global! kingfa sci. leads, huitong, preter, and kumho nire follow, china’s modified plastics frenziedly expanding worldwide
-

Back-to-back major joker moves! covestro’s 1.32 million ton mdi dual-line expansion and hdi acquisition reshape global polyurethane landscape
-

Evonik Parts Ways With The Polyester Business! A Strategic Retreat By A Germany Chemical Giant And The Global Industry Shift
-

PA66 Cost and Profit: Broad-Based Weakness in the Feedstock Market Continues to Erode Cost Support for PA66 (202606)


