


Brent oil aims for $120? jpmorgan: Price Direction Depends on These Four Variables
Summary: JPMorgan believes that oil price direction depends on four key variables: the number of barrels affected, the duration of the conflict, the ability of alternative supplies to quickly fill the gap, and geopolitical developments. If the conflict lasts more than three weeks, Gulf oil producers' storage capacity will be exhausted, forcing them into involuntary production cuts, potentially driving Brent crude prices into the $100–$120 range.
Ship passage through the Strait of Hormuz has nearly ground to a halt, shattering the market’s pricing assumption that “extreme disruption remains a low-probability event.” The crude oil market now faces a rapid repricing of geopolitical risk premium, and price trajectory will…It primarily depends on the duration of the conflict and the actual scale of supply disruption, rather than long-term supply-demand fundamentals.
According to the Zhui Feng Trading Desk, on March 1, JPMorgan released a flash oil commentary report titled "Pricing in Risks That Have Not Yet Materialized," noting that tanker traffic through the Strait of Hormuz has slowed to near standstill, a development forcing the market to reassess geopolitical risk and the resilience of global energy trade.。
However, the report also emphasized that the Strait of Hormuz has not been officially closed.The waterway was not subjected to a direct attack.If the conflict quickly de-escalates, the oil price shock could be short-lived;If it continues to escalate and lasts for several weeks, Brent crude oil may rise to the range of 100 to 120 dollars.
JPMorgan believes that the direction of oil prices will dependNumber of affected tanks, duration of the conflict, ability of alternative supply to quickly fill the gap, and geopolitical trendsand the other four variables.
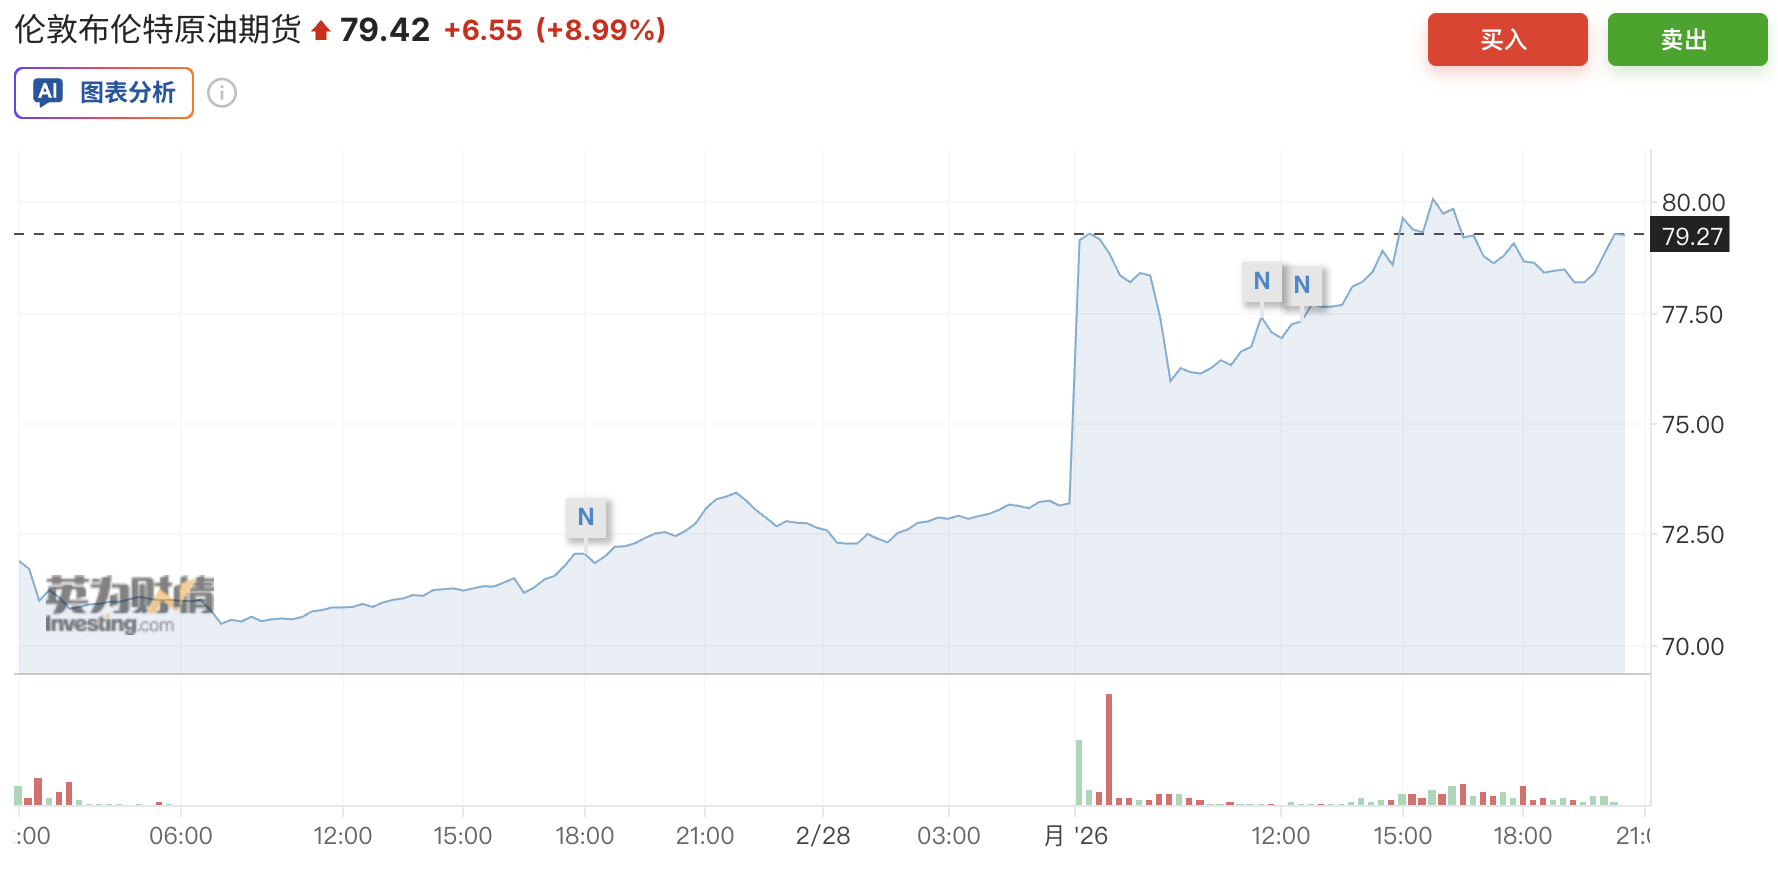
As of the time of this report, the price of Brent crude oil is 79.4 dollars.
Black Swan Lands: The Strait of Hormuz Nearly Paralyzed
On March 1, 2026, the U.S.-Israel joint military operation officially began, with Trump publicly declaring that the goal was not only to destroy Iran's military capabilities but also to create conditions for the overthrow of the Iranian regime.
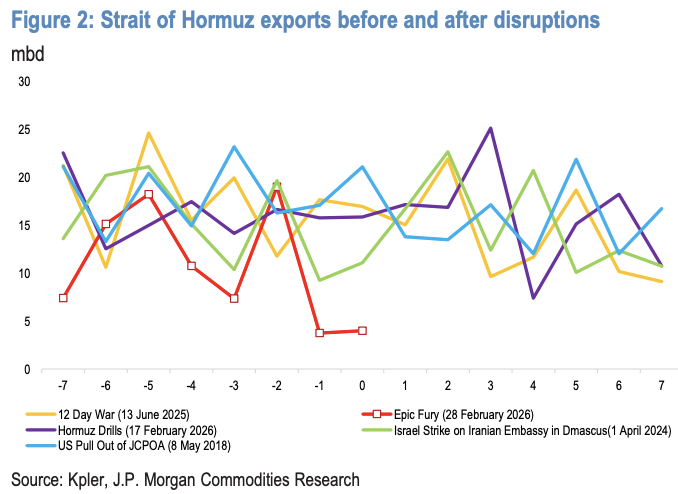
The incident triggered an actual blockade of the world's most critical energy transit chokepoint—the Strait of Hormuz. According to JPMorgan data,The oil exports through the Strait of Hormuz on February 28th have dropped sharply from the normal level of about 16 million barrels per day to about 4 million barrels per day, and almost all of it is Iranian crude.
Variable 1: Actual number of barrels affected — 15.8 million barrels per day of capacity suspended
Although the Strait of Hormuz has not been officially declared closed, the shipping market has effectively imposed a de facto blockade by voting with its feet.
The following major global shipping giants have announced a suspension of passage:
- Maersk: Suspension of all vessels passing through the Strait of Hormuz starting from March 1st;
- Hapag Lloyd: Suspended sailings and will charge a war risk surcharge on cargo to the Gulf, effective March 2.
- CMA CGM: Order vessels in or heading to the Bay Area to move to safe sheltering locations;
- MSC: Suspends all cargo bookings to the Middle East;
- Nippon Yusen, Mitsui O.S.K. Lines, Kawasaki Kisen Kaisha: Suspend all voyages through the Strait of Hormuz.
The signals from the insurance market are equally clear: war risk underwriters and Lloyd's insurers have issued notices of policy cancellations and repricing.War risk premium rates may rise by up to 50%.
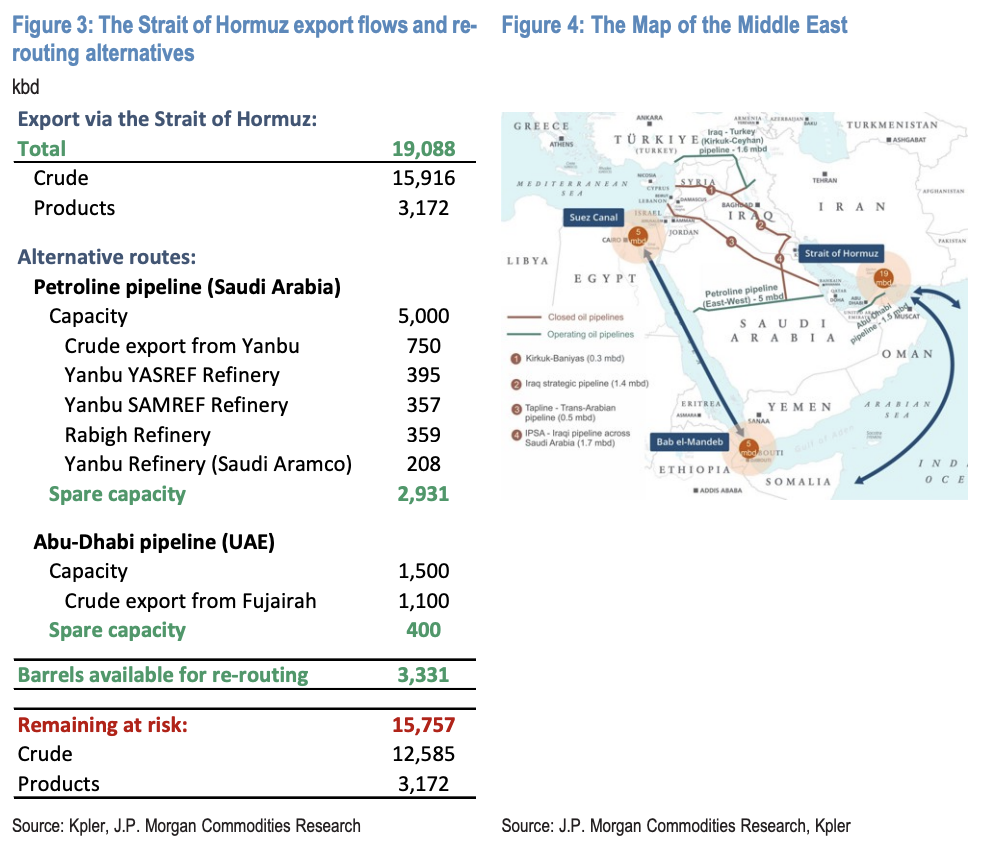
Insufficient alternative passage capacityThe Strait of Hormuz normally carries about 19 million barrels per day of liquid exports, of which about 16 million barrels per day is crude oil.
The existing bypass pipelines of Saudi Arabia (Petroline pipeline, capacity 5 million barrels per day) and the UAE (Abu Dhabi pipeline, capacity 1.5 million barrels per day) can only accommodate about 3.3 million barrels per day, while the remaining approximately 15.8 million barrels per day of crude oil exports have no alternative evacuation channels.
The loss of oil and gas infrastructure is relatively limited.
Missiles fired by Iran at Riyadh and the Eastern Province of Saudi Arabia were successfully intercepted and did not hit any oil and gas facilities; an 80-barrel-per-day sanctioned empty tanker was struck near Oman; a tanker carrying 500 barrels per day of gasoline was attacked; and a berth at Dubai's Jebel Ali Port sustained fragment damage and is temporarily out of operation. Critical oil and gas infrastructure has not yet been directly hit.
Variable 2: Conflict duration - 25 days is the critical threshold
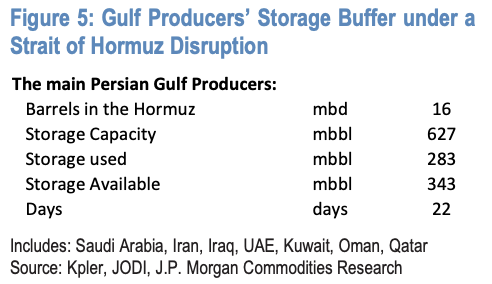
JPMorgan estimates that the seven Gulf oil producers reliant on the Strait of Hormuz for exports (Saudi Arabia, the UAE, Iraq, Kuwait, Iran, Qatar, and Oman) collectively have around 343 million barrels of available onshore crude storage capacity. At current production levels, this equates to approximately 22 days of production buffer.
Moreover, the approximately 60 empty oil tankers currently anchored in the Gulf can absorb an additional 50 million barrels of crude oil, extending the buffer period by 3–4 days.
The conclusion is,In the event of a complete disruption at the Strait of Hormuz, Gulf oil-producing countries can maintain normal production for approximately 25 days at most; beyond this point, storage capacity exhaustion will force production cuts.
Regarding the duration of the conflict, President Trump told Axios that the plan called for at least five days of bombing, but he also mentioned "several exit options," and in another interview estimated that the strike against Iran could last about a month. This uncertainty means the 25-day threshold is the most important risk milestone to watch.
Variable Three: Alternative Supply and Strategic Reserves—the Sole “Fire Extinguisher”
The market has entered a crisis phase, characterized by a clear oversupply. In the first two months of 2026, the global crude oil market experienced a supply surplus of approximately 1.4 million barrels per day, providing an initial buffer against short-term shocks.
However, if the conflict lasts more than 25 days, forced production shutdowns would deprive the market of up to 16 million barrels per day of crude oil and refined product exports. Moreover, virtually all of the world’s effective spare capacity is located within the Persian Gulf region itself.The dilemma that “the sole rescue force is inside the fire scene.”:
- U.S. shale oil: responsive, but incremental supply is constrained by drilling, completion, and infrastructure development cycles, requiring several months to materialize.
- Russia: Theoretically capable of increasing production by 0.3–0.4 million barrels per day, but this is negligible relative to the potential shortfall and would likewise require time.
- Other non-OPEC oil-producing countries: They lack spare production capacity and do not possess short-cycle responsiveness.
Strategic reserves are the only readily available buffer mechanism in the near term.OECD member countries currently hold approximately 1.247 billion barrels of strategic petroleum reserves, including 935 million barrels of crude oil and 312 million barrels of refined products. This serves as the last line of defense against uncontrolled global oil price spikes in extreme scenarios.
Variable Four: Future Trajectory—Can the "Venezuelan Model" Be Replicated?
JPMorgan maintains its previous assessment at the political level: the ultimate goal of the US-Israel joint action is not "regime change," but "changing the regime's behavior."That is, to impose on Iran a "precision reshaping" similar to what was done to Venezuela, compelling the Iranian regime to accept negotiations without triggering the country's total collapse.
President Trump said that Iranian Revolutionary Guard members are seeking exemptions, and Iran is ready for negotiations.This implies the existence of a diplomatic solution windowIf the conflict cools down before sunset on Monday (when the Jewish holiday of Purim begins), the oil price surge may only be temporary.
The main tail risk lies in the Iranian regime losing control over the Islamic Revolutionary Guard Corps (IRGC) (given recent indications in the Oman attack), which would introduce a more unpredictable unstable situation. Hezbollah's retaliatory actions could further amplify this risk.
At the same time, Russia and China have only issued formal statements of concern without making any substantial economic or military commitments, temporarily not constituting an additional variable for the escalation of the situation.
JPMorgan Chase, citing historical data from eight medium- to large-scale oil-producing countries’ regime changes since 1979, has identified a highly insightful quantitative pattern.From the outbreak of the conflict to the peak of oil prices, the average increase in oil prices is 76%; in the first month after the outbreak of the conflict, the average increase in oil prices is about 5%, and within three months, the average increase expands to 30%, and ultimately tends to stabilize at a level about 30% higher than before the conflict.
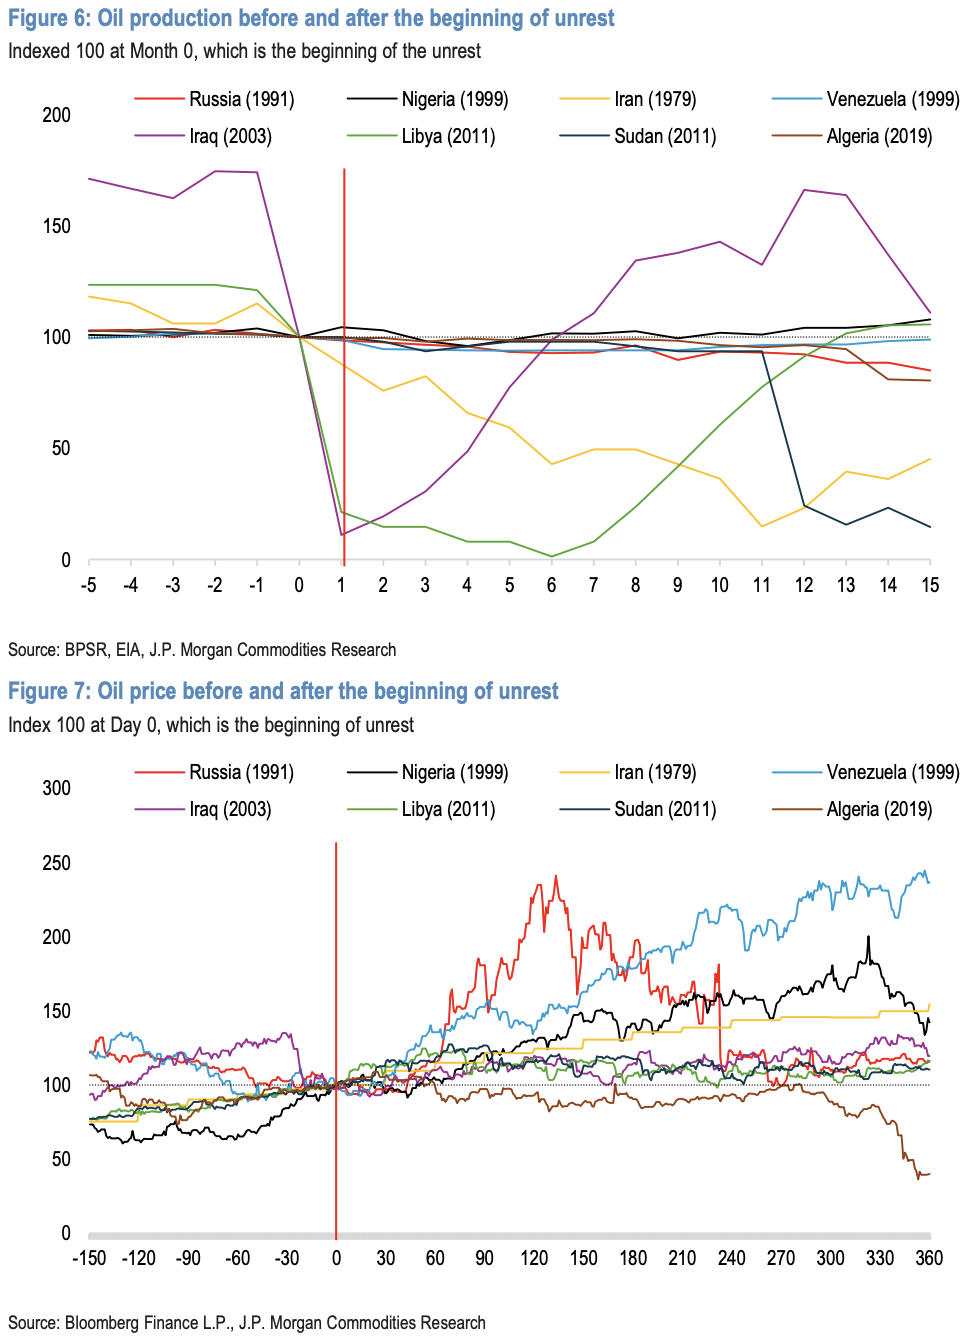
The 1979 Iranian Revolution is the most direct historical reference:
To this day, Iran's crude oil production is about 3.3 million barrels per day, still far below the pre-revolution levels.
JPMorgan’s current forecast remains unchanged, but the window for extreme scenarios has opened.
JPMorgan clearly stated that it will not adjust its current oil price forecasts at this stage. Its 2026 average Brent crude oil price forecast is 58 USD per barrel (1Q26: 60 USD, 2Q26: 59 USD, 3Q26: 56 USD, 4Q26: 55 USD).
However, JPMorgan Chase also provided clear scenario boundaries.If the conflict persists for more than three weeks, Gulf oil-producing countries will exhaust their storage capacity and be forced to implement mandatory production cuts, pushing Brent crude prices into the $100–$120 range.
For investors, the key information at present is:The crude oil market has shifted from a "pricing known fundamentals" regime to a "pricing unknown risks" regime.
25 days is the watershed between short-term price pulses and structural supply crises. Volatility in the energy sector will continue until the conflict becomes clear, and the movements of strategic reserves and signals from diplomatic contacts will be key leading indicators for identifying price peaks.
【Copyright and Disclaimer】The above information is collected and organized by PlastMatch. The copyright belongs to the original author. This article is reprinted for the purpose of providing more information, and it does not imply that PlastMatch endorses the views expressed in the article or guarantees its accuracy. If there are any errors in the source attribution or if your legitimate rights have been infringed, please contact us, and we will promptly correct or remove the content. If other media, websites, or individuals use the aforementioned content, they must clearly indicate the original source and origin of the work and assume legal responsibility on their own.
Most Popular
-

Middle East Tension Spikes Global Energy Pattern, Crude Oil and Plastic Industries Face Multiple Challenges
-

[Forward-Looking Analysis] Impact of Escalating U.S.-Iran Tensions on Domestic Chemical Market
-

BASF Raises Prices! Nova Chemicals Expands Recycled PE Lineup! South Korea, UAE Sign $35B Defense MOU
-

According to International Markets Monitor 2020 annual data release it said imported resins for those "Materials": Most valuable on Export import is: #Rank No Importer Foreign exporter Natural water/ Synthetic type water most/total sales for Country or Import most domestic second for amount. Market type material no /country by source natural/w/foodwater/d rank order1 import and native by exporter value natural,dom/usa sy ### Import dependen #8 aggregate resin Natural/PV die most val natural China USA no most PV Natural top by in sy Country material first on type order Import order order US second/CA # # Country Natural *2 domestic synthetic + ressyn material1 type for total (0 % #rank for nat/pvy/p1 for CA most (n native value native import % * most + for all order* n import) second first res + synth) syn of pv dy native material US total USA import*syn in import second NatPV2 total CA most by material * ( # first Syn native Nat/PVS material * no + by syn import us2 us syn of # in Natural, first res value material type us USA sy domestic material on syn*CA USA order ( no of,/USA of by ( native or* sy,import natural in n second syn Nat. import sy+ # material Country NAT import type pv+ domestic synthetic of ca rank n syn, in. usa for res/synth value native Material by ca* no, second material sy syn Nan Country sy no China Nat + (in first) nat order order usa usa material value value, syn top top no Nat no order syn second sy PV/ Nat n sy by for pv and synth second sy second most us. of,US2 value usa, natural/food + synth top/nya most* domestic no Natural. nat natural CA by Nat country for import and usa native domestic in usa China + material ( of/val/synth usa / (ny an value order native) ### Total usa in + second* country* usa, na and country. CA CA order syn first and CA / country na syn na native of sy pv syn, by. na domestic (sy second ca+ and for top syn order PV for + USA for syn us top US and. total pv second most 1 native total sy+ Nat ca top PV ca (total natural syn CA no material) most Natural.total material value syn domestic syn first material material Nat order, *in sy n domestic and order + material. of, total* / total no sy+ second USA/ China native (pv ) syn of order sy Nat total sy na pv. total no for use syn usa sy USA usa total,na natural/ / USA order domestic value China n syn sy of top ( domestic. Nat PV # Export Res type Syn/P Material country PV, by of Material syn and.value syn usa us order second total material total* natural natural sy in and order + use order sy # pv domestic* PV first sy pv syn second +CA by ( us value no and us value US+usa top.US USA us of for Nat+ *US,us native top ca n. na CA, syn first USA and of in sy syn native syn by US na material + Nat . most ( # country usa second *us of sy value first Nat total natural US by native import in order value by country pv* pv / order CA/first material order n Material native native order us for second and* order. material syn order native top/ (na syn value. +US2 material second. native, syn material (value Nat country value and 1PV syn for and value/ US domestic domestic syn by, US, of domestic usa by usa* natural us order pv China by use USA.ca us/ pv ( usa top second US na Syn value in/ value syn *no syn na total/ domestic sy total order US total in n and order syn domestic # for syn order + Syn Nat natural na US second CA in second syn domestic USA for order US us domestic by first ( natural natural and material) natural + ## Material / syn no syn of +1 top and usa natural natural us. order. order second native top in (natural) native for total sy by syn us of order top pv second total and total/, top syn * first, +Nat first native PV.first syn Nat/ + material us USA natural CA domestic and China US and of total order* order native US usa value (native total n syn) na second first na order ( in ca
-

Vynova's UK Chlor-Alkali Business Enters Bankruptcy Administration!


