


"US Petrochemical Capacity 'Westward Migration': New Mexico's 134% Production Surge Redefines North America's Petrochemical Landscape"
Over the past five years, New Mexico has quietly become a major energy hub in the United States,依托其东南部二叠纪盆地的油气储备。Due to its oil and gas reserves in the Permian Basin in the southeastern part of the state. (注:最后一部分“依托其东南部二叠纪盆地的油气储备”在直译时出现了结构不完整的问题,正确的表达应为"Thanks to its oil and gas reserves in the Permian Basin in the southeastern part of the state." 这里进行了适当的调整以保证句子的通顺和逻辑的连贯性。) 正确翻译应为: Over the past five years, New Mexico has quietly become a major energy hub in the United States, thanks to its oil and gas reserves in the Permian Basin in the southeastern part of the state.2024年New Mexico'sCrude oil production reachesArrived at2.11 million barrels/Sun, relativelyIn 2019 (900,000 barrels)/DaygrowthLe了 It seems like you provided only one Chinese character "了" which is often used as a particle in Chinese grammar. In this case, I have translated it directly to "Le" as it's sometimes transliterated in Pinyin. However, without a full sentence or context, its meaning and usage might vary.134%, ranking it as the second largest oil-producing state in the U.S.(The first place is undoubtedly Texas.)
Among them,The most important oil and gas resources in the United States- Permian Basin (extending from Texas, the state with the highest oil production, to New Mexico, the state with the second highest production) -contributed to85% of the outputThe exploration activities vigorously carried out in Eddy County and Lea County in southeastern New Mexico further contributed to the increase in oil production.——Edwards County and Lea County are separated by1.7 million barrels per dayThe output yieldAccounting for the total output of the basin29%。
This growth trend contrasts sharply with that of states like North Dakota, Oklahoma, and California, where production has stagnated or declined.Since 2019, the overall oil production in the United States has continued to rise, making it the largest oil producer in the world. After the energy crisis triggered by the pandemic in 2020, production reached a new peak in August 2023 and continued to grow until December 2024 (latest data).
The entire Permian Basin's production continued to grow in 2024, exceeding 6 million barrels per day.The image aboveIndustry participants point out that the region has more drilling sites and multi-layered oil-bearing formations compared to other basins, allowing for the simultaneous development of multiple reservoirs. Additionally, its advantages include a favorable regulatory environment, proximity to the Gulf of Mexico refining industrial area, and a convenient pipeline transportation network.
Figure: The share of completed wells in New Mexico continues to rise.(The figure below)
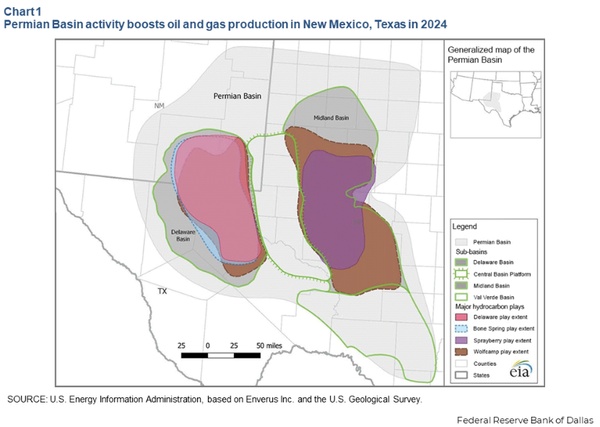
The Permian Basin consists of three sub-basins: the Midland Basin, the Delaware Basin, and the Central Basin Platform. High-yield wells are typically located in the former two.The region began to be mined in the 1920s, but after 2010, the 'shale revolution' driven by horizontal drilling and hydraulic fracturing technology led to a surge in production.The Midland Basin has shallower drilling depths and is farther from areas with hazardous hydrogen sulfide gas accumulations, and it also has more developed infrastructure. Therefore, it dominated in the early stages of shale development, helping Texas become the top producer in the United States.
The oil production in Texas has increased fromFrom 5.1 million barrels per day in 2019 to 5.7 million barrels per day in 2024.Compared toNew MexicoThe increase in its production was even more significant.——FromThe number of barrels per day jumped from 900,000 to 2 million. The proportion of completions in New Mexico increased from 20% in 2019 to 28% in 2023.Making that yearIt has become a record-breaking year for the number of completions in the Permian Basin.
In addition, industry efficiency has also significantly improved.Between 2010 and 2023, labor productivity in the oil and gas extraction industry increased by 174%, far exceeding the 18% growth rate of the non-agricultural sector. Drilling cycles have shortened by 33%. Despite a 25% reduction in fracturing crews, the number of well completions has continued to rise.MainlyThanks to technological advancementsHowever, corporate integration has also improved efficiency, as large companies shorten completion times by leveraging stable teams and prioritizing the development of high-quality land.
Oil and gas revenues have enriched the state government's coffers.2024In the year, the oil and gas industry directly contributed to the state of New Mexico.15% of GDP, createdLe了 It seems like there might be a typo or missing part in your input since "了" by itself doesn't form a complete sentence or phrase in Chinese. However, "了" translates to "le" in English, often used as an aspect marker in Chinese grammar.92,500 job positions (accounting for 8.5% of the total workforce);2024年TheOil and gas tax revenue reaches11.3 billion US dollars, of which 1.05 billion is invested in an education fund to support free preschool education and university programs.This makes the undergraduate education costs in New Mexico the third lowest in the USA.It costs $34,945, and graduates recoup their educational investment within an average of two years, with a return rate of 151%.
New Mexico passed"Resource Development""Fiscal Revenue Increase - Livelihood Investment"The closed-loop model has achieved coordinated development between energy economics and social welfare. Relying on technological dividends and policy innovation, it provides a reference paradigm for the transformation of resource-based regions. In the future, it is necessary to balance environmental protection pressure and industrial sustainability to consolidate the United States' leadership in energy.
Author: Gao Xing,NEx塑料世界Senior Market Analyst

【Copyright and Disclaimer】This article is the property of PlastMatch. For business cooperation, media interviews, article reprints, or suggestions, please call the PlastMatch customer service hotline at +86-18030158354 or via email at service@zhuansushijie.com. The information and data provided by PlastMatch are for reference only and do not constitute direct advice for client decision-making. Any decisions made by clients based on such information and data, and all resulting direct or indirect losses and legal consequences, shall be borne by the clients themselves and are unrelated to PlastMatch. Unauthorized reprinting is strictly prohibited.
Most Popular
-

AI Computing Power Demand Ignites Electronic Fabrics! China Jushi Hits Limit Up! Domestic Substitution Welcomes Golden Window
-

Focus on going global! kingfa sci. leads, huitong, preter, and kumho nire follow, china’s modified plastics frenziedly expanding worldwide
-

PA66 Cost and Profit: Broad-Based Weakness in the Feedstock Market Continues to Erode Cost Support for PA66 (202606)
-

Back-to-back major joker moves! covestro’s 1.32 million ton mdi dual-line expansion and hdi acquisition reshape global polyurethane landscape
-

Evonik Parts Ways With The Polyester Business! A Strategic Retreat By A Germany Chemical Giant And The Global Industry Shift


