


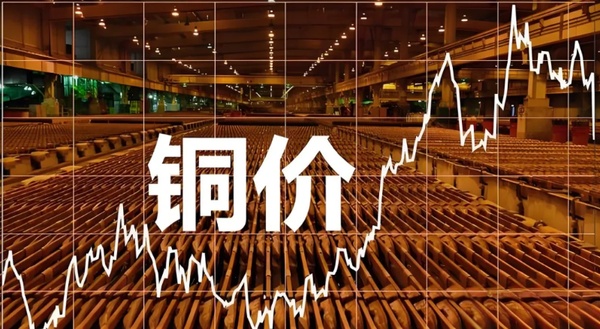
Trump's tariff stick has led to a surge in copper prices, putting domestic home appliance companies under increased cost pressure.
The significant fluctuations in global copper prices have drawn attention from the home appliance industry. Although the sharp rise in international copper futures prices, driven by U.S. tariffs, currently mainly affects psychological expectations, it is an issue that cannot be overlooked in the long term.
Recently, international copper prices have experienced significant fluctuations. On the evening of March 25 (Tuesday), LME metal futures generally rose, with London copper breaking through the $10,000 mark. By the close of that day, London copper was quoted at $10,094.5, up $160, an increase of 1.61%, reaching the highest level since early October last year.
The news of the rise in copper prices immediately drew attention from various domestic parties. In addition to investors in metal trading, industries that rely heavily on copper materials also paid close attention, sparking various discussions in the market.
The US tariff stick has triggered a surge in copper prices.
Professionals interviewed stated, "A large influx of copper into the United States will create a severe supply shortage for other regions of the world, especially the major copper-consuming countries. We believe that something unusual is happening in the copper market."
As analysts have pointed out, copper prices are predicted to soar to historic highs—up to one-third higher than current levels. As of last Friday, LME copper was priced at $9,852 per ton. A professional metal market analyst stated, "Is it reasonable to expect copper prices to reach $12,000 or $13,000 per ton? I find it hard to provide specific numbers because this situation is unprecedented."
In other words, there is still room for copper prices to rise in the future. According to the world's largest trading companies, due to growing global demand and the threat of trade tariffs by Trump, copper prices are likely to hit a new record of $12,000 per ton or higher this year.
The logic behind the recent rise in copper prices is not difficult to understand. It stems from the changes in Trump's tariff policy. On March 5, Trump mentioned in a speech to Congress, due to a slip of the tongue, that tariffs had already been imposed on copper, which caused fluctuations in copper prices on the New York Stock Exchange. Recently, U.S. officials have also revealed that a national security investigation under Section 232 of the Trade Expansion Act has been initiated regarding copper imports, and there is a possibility of implementing a 25% tariff at any time.
This time, the Trump camp has threatened to impose tariffs as high as 25% on all imported copper, a move that could disrupt global markets. The logic is simple: if U.S. copper futures prices rise, copper from producing regions will flow to the U.S., while China is the world's largest consumer of copper. A supply imbalance will inevitably lead to price increases.
Moreover, the surge in tariffs and the increase in related uncertainties have heightened the risk of a hard landing for the global economy, leading to social and economic reasons for the instability of copper prices. As the largest consumer of copper, China pays close attention to the trends in copper prices.

The air conditioning industry in the home appliance sector is suffering the most.
Copper is widely used in industries such as technology, construction, power, and manufacturing. It is a key material for wires and power grids. In家电制造对铜的依赖性也很强,其中一些关键零部件离不开铜材料。因此,铜价飙升会引发家电制造成本的提升。 Copper has a strong dependence in home appliance manufacturing, with some critical components being inseparable from copper materials. Therefore, a surge in copper prices can lead to an increase in the cost of home appliance manufacturing.
China is a major manufacturing country but also a copper-poor nation, relying heavily on imported copper materials. The home appliance industry is particularly sensitive to copper prices, as any significant fluctuations in copper prices often lead to adjustments in the prices of end products.
In the household appliance sector, the use of copper varies across different products. Many appliance components rely on copper materials, such as motors, compressors, connecting pipes, and wires, which are either made entirely of copper or partially, like enameled wires. In other words, any household appliance that utilizes motors or compressors depends on copper materials to some extent.
To reduce costs, some products like refrigerators have replaced copper with aluminum in components such as heat sink connecting pipes. Similarly, the connection between air conditioner hosts and outdoor units also employs "aluminum replacing copper" technology. Although the technology is no longer an issue, not all products can adopt this approach.
Compared with air conditioners, refrigerators now use a fully enclosed back, so users cannot see the cooling system and connecting pipes. However, the connecting pipes of air conditioners, whether made of copper or aluminum, are visible to both dealers and users. Therefore, due to fierce market competition, it is relatively difficult to promote the replacement of copper with aluminum in air conditioners.
Among them, in this round of copper price increase, the hardest hit in household appliances is the air conditioning industry. It is reported that the copper used in ordinary air conditioners accounts for about 20%, ranging from 4 to 10kg depending on the size of the air conditioner, including compressor, motor, copper wire, copper connecting pipe and other parts.
Some media are now interviewing air conditioning terminal stores, and the answer is that it hasn't happened yet. It's just that copper is the most upstream raw material, and it takes time for price increases to be passed on to end products. Manufacturing companies are basically using copper they purchased last year or even earlier.
Currently, the rise in LME copper prices is still confined to futures and has not yet been transmitted to physical goods and manufacturing. It remains merely a psychological and anticipatory impact. This is because companies with high copper usage have either stockpiled in advance or used hedging to lock in prices.
However, after futures rise and stabilize at a certain high level, they will inevitably be passed on to the manufacturing sector eventually. Therefore, the pressure on manufacturing companies will gradually become apparent.
【Copyright and Disclaimer】The above information is collected and organized by PlastMatch. The copyright belongs to the original author. This article is reprinted for the purpose of providing more information, and it does not imply that PlastMatch endorses the views expressed in the article or guarantees its accuracy. If there are any errors in the source attribution or if your legitimate rights have been infringed, please contact us, and we will promptly correct or remove the content. If other media, websites, or individuals use the aforementioned content, they must clearly indicate the original source and origin of the work and assume legal responsibility on their own.
Most Popular
-

AI Computing Power Demand Ignites Electronic Fabrics! China Jushi Hits Limit Up! Domestic Substitution Welcomes Golden Window
-

Focus on going global! kingfa sci. leads, huitong, preter, and kumho nire follow, china’s modified plastics frenziedly expanding worldwide
-

PA66 Cost and Profit: Broad-Based Weakness in the Feedstock Market Continues to Erode Cost Support for PA66 (202606)
-

Back-to-back major joker moves! covestro’s 1.32 million ton mdi dual-line expansion and hdi acquisition reshape global polyurethane landscape
-

Evonik Parts Ways With The Polyester Business! A Strategic Retreat By A Germany Chemical Giant And The Global Industry Shift


