


The synthetic fiber industry will recover growth in 2024 and operate steadily in 2025.
In 2024, as a key year for promoting the "14th Five-Year Plan" and an important year for the layout of comprehensive deepening reform goals, China's economic operations are showing a generally stable and progressively improving positive trend. High-quality development is steadily advancing, and the process of Chinese-style modernization is making solid strides. In this macro environment, the chemical fiber industry is taking positive actions and exhibiting a restorative growth trend, with significant positive changes in the main operational indicators of the industry. This year, China's economic operations are generally stable and progressing steadily, with high-quality development being solidly promoted and Chinese-style modernization making new solid steps. Against this backdrop, the chemical fiber industry is showing a trend of restorative growth, with major operational indicators achieving positive changes. Among them, the industry's average operating load is at a high level, and production is growing rapidly; in the face of increasing export pressure, chemical fiber companies are actively expanding international markets, achieving positive growth in export volume; economic efficiency has improved year-on-year, with annual revenue remaining above 1 trillion yuan, and operational quality has improved.
I. Basic Situation of the Chemical Fiber Industry Operation in 2024
High relative load and rapid growth in output.
In 2024, the average operating load of the chemical fiber industry remains high, with an overall level higher than in 2023. In particular, the average operating loads of polyester direct spinning filament and nylon civilian filament are both above 90%, representing increases of 7.8 and 8.8 percentage points compared to 2023, respectively. In terms of stages: from March to April, downstream demand was better than expected, and most sub-industries in chemical fibers operated at high levels compared to the same period in previous years. However, high operating rates led to inventory accumulation and narrowed profits. Coupled with the onset of the off-season, demand weakened, and some polyester and polyester enterprises even reported losses, resulting in a decline in operating load from June to August. In September, the operating rates in downstream increased, leading to a slight rise in the operating load of the chemical fiber industry. The fourth quarter is expected to continue operating at a high level.
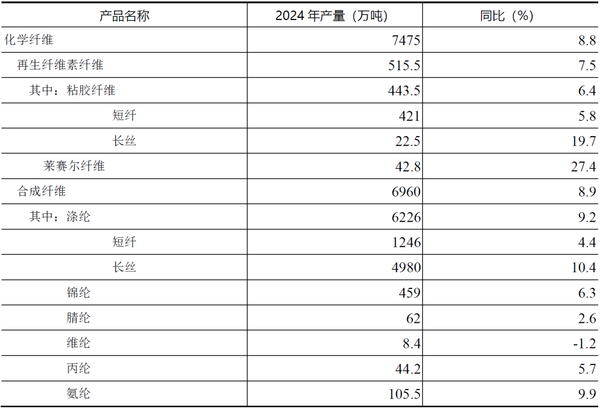
In the context of a high production capacity base and high operating rates, the production of chemical fibers is expected to grow rapidly in 2024. According to statistics from the China Chemical Fiber Association, the production of chemical fibers in 2024 is projected to be 74.75 million tons, an increase of 8.8% year-on-year (Table 1). Among them, the production of polyester filaments and spandex is expected to grow by about 10% year-on-year, the production of nylon is expected to increase by 6.3% year-on-year, the production of viscose staple fiber is expected to grow by 5.8% year-on-year, and the production of lyocell fibers is expected to see a year-on-year increase of 27.4%.
Table 1: Completion Status of China's Chemical Fiber Production in 2024
(2) Terminal demand has achieved growth, but pressures have become apparent.
In 2024, a package of policies was timely introduced, effectively boosting social confidence and significantly reviving the economy, leading to a moderate growth in domestic consumption of textiles and apparel. According to data from the National Bureau of Statistics, in 2024, China's per capita clothing consumption expenditure increased by 2.8% year-on-year; the retail sales of clothing, shoes, hats, and textile products above the designated size increased by 0.3% year-on-year, a decrease of 12.6 percentage points compared to 2023; and the online retail sales of clothing-related products increased by 1.5% year-on-year, a decrease of 9.3 percentage points compared to 2023.
In terms of external demand, the competitiveness of China's textile industry chain continues to be released, effectively withstanding the relatively severe foreign trade situation, with a positive growth in exports for the whole year. Among them, due to concerns about the risks of the China-U.S. trade environment, some enterprises "rushed to export" in the fourth quarter, leading to an accelerated increase in exports during that period. According to data from Chinese customs, in 2024, China's total export value of textiles and garments reached $301.1 billion, a year-on-year increase of 2.8%. Among this, the export value of textiles was $141.96 billion, up 5.7%, while the export value of garments was $159.14 billion, up 0.3%. Overall, China's textile and garment exports to major markets performed well, but there were differences in performance; exports to major trading partners such as the United States, the European Union, and ASEAN showed good growth, while exports to markets like Japan, Turkey, and Russia experienced negative growth.
From the perspective of the direct downstream of chemical fibers, the output of chemical fiber yarn and chemical fiber staple fabric increased by 8.2% and 3.4% year-on-year, respectively. In terms of the operating rates of major downstream industries (texturing, weaving, and polyester yarn), all have improved compared to 2023, with a noticeable increase in the operating rate of texturing. From the transaction volume in the light textile city, the average value is slightly lower than that of 2023.
(3) Export growth rate was low at first and then high, showing a recovery trend for the whole year.
According to data from Chinese customs, in 2024, the export volume of chemical fiber products reached 6.65 million tons, a year-on-year increase of 2.16% (Table 2), indicating a recovery in growth for the whole year. In terms of export destinations, the reduction in exports to India had a significant impact. In October 2023, India implemented BIS certification for polyester filament, leading to a surge in exports of polyester filament as companies rushed to export before the certification. In 2024, the export volume of polyester filament did not maintain the high growth trend of the previous year, with an annual decrease of 2.50%. However, excluding India, the actual exports of polyester filament to other countries and regions showed growth. Additionally, there were significant changes in the market share of chemical fiber exports (Figure 1), with shares for India and Turkey decreasing by 5.6 and 2.6 percentage points, respectively, while shares for Vietnam, Pakistan, and Egypt saw notable increases.
Table 2 Major Import and Export Situation of Chemical Fiber Products in 2024
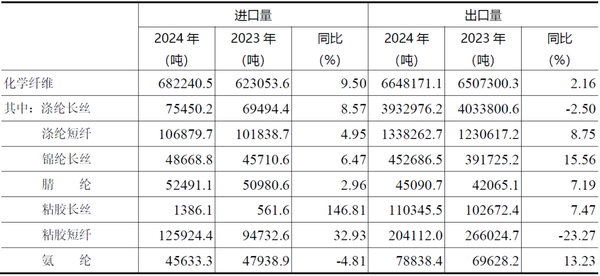
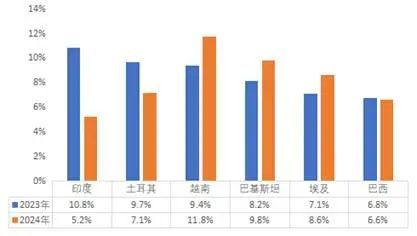
Figure 1 Changes in China's major export market share for chemical fibers
In the first half of the year, the chemical fiber market was relatively stable, while cost support weakened in the second half.
In 2024, oil prices fluctuated in the range of $66 to $87 per barrel (Figure 2). Geopolitical disturbances in the first half of the year led to a rising trend, with prices reaching a yearly high of $87 per barrel in early April. In the second half of the year, the Federal Reserve lowered interest rates, and market expectations of an economic downturn weakened demand, causing oil prices to continuously decline, dropping to a yearly low of $66 per barrel in early September. Subsequently, the market entered a phase of "oscillation and bottoming."
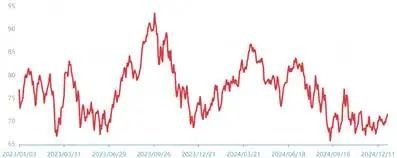
Figure 2 WTI Oil Price Trend Chart for 2023-2024
Although crude oil prices showed an upward trend in the first half of the year, the correlation between PTA, polyester prices, and crude oil prices was relatively weak, and the market fluctuations were relatively stable, with prices influenced more by supply and demand dynamics (Figure 3). In the second half of the year, as crude oil prices continued to decline, the support from the cost side weakened, and chemical fiber prices showed a downward trend. Taking the polyester chain as an example, the price of PTA decreased from 6015 yuan/ton at the beginning of July to 4760 yuan/ton by the end of the year, a drop of 26%; the price of polyester POY fell from 8015 yuan/ton at the beginning of July to 7040 yuan/ton by the end of the year, a drop of 14%.
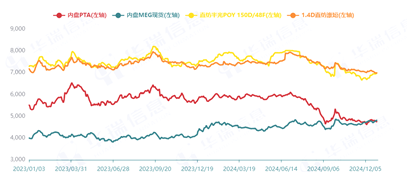
Figure 3 Price Trend of Polyester and Its Raw Materials from 2023 to 2024
(E) Economic benefits have improved year-on-year, and operational quality has seen some improvement.
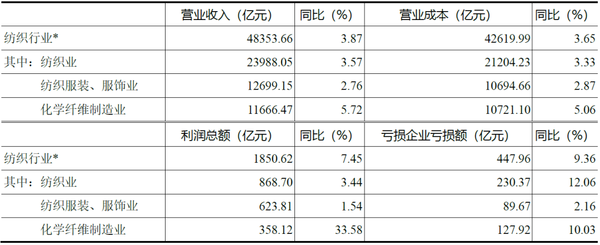
In 2024, the economic benefit indicators of the chemical fiber industry have shown positive changes. According to data from the National Bureau of Statistics, the chemical fiber industry achieved operating revenue of 1,166.6 billion yuan, a year-on-year increase of 5.72%; the total profit reached 35.8 billion yuan, a year-on-year increase of 33.58%. However, as the low base effect gradually weakens, the profit growth rate is narrowing. The operating income profit margin is 3.07%, which, although still relatively low compared to recent years, shows an upward trend compared to the previous period. The chemical fiber industry contributes approximately 18.5% of the profits for the entire textile industry, an increase of 3.6 percentage points from 2023; the industry's loss ratio is 23.12%, a reduction of 2.4 percentage points from 2023, and the losses of loss-making enterprises decreased by 10.03% year-on-year (Table 3).
From an industry perspective, the profits of the polyester, nylon, and cellulose fiber industries have significantly improved compared to 2023, contributing 48%, 18%, and 23% to the overall profits of the chemical fiber industry, respectively. Specifically, the polyester industry's profit levels faced some pressure in the first half of the year, but improved in the second half as processing margins gradually recovered. The nylon industry showed relatively stable profit levels, driven by strong demand in the outdoor and sports sectors, which boosted nylon consumption and created profit opportunities for the industry. In contrast, the overall profits of the spandex industry decreased noticeably; on one hand, this was due to the decline in raw material prices, and on the other hand, the introduction of new production capacity created supply pressure. Coupled with demand not meeting expectations, the industry's inventory levels are relatively high, leading to a downward trend in product prices.
Table 3 Economic Benefits of the Chemical Fiber and Related Industries in 2024
Fixed asset investment growth has rebounded, while actual新增产能 has slowed down.
According to data from the National Bureau of Statistics, the fixed asset investment in the chemical fiber industry in 2024 is expected to increase by 4.7% year-on-year, compared to -9.8% in 2023. The investment growth has rebounded due to the low base effect. However, in terms of new capacity, 196,000 tons of polyester fiber will be newly invested in 2024, which alleviates the pressure of new capacity in the industry. In addition, industry enterprises are increasingly focusing on the upgrading and transformation of existing capacity towards high-end, intelligent, and green development, with solid and effective steps in transformation and upgrading.
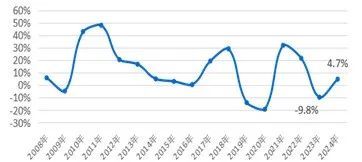
Figure 4 Changes in Fixed Asset Investment Growth Rate of the Chemical Fiber Industry from 2008 to 2024
II. Outlook for the Chemical Fiber Industry in 2025
From an external environment perspective, the global economy in 2025 will continue to be on a low growth trajectory. In March, the OECD revised its 2025 global economic growth forecast down from 3.3% to 3.1%. At the same time, global production and consumption costs are rising, international trade is hindered, global supply chains are becoming more fragmented, and the geopolitical situation is increasingly unpredictable, leading to greater uncertainty in the global economy.
From the internal environment perspective, the "2025 Government Work Report" proposes expected targets, including: a domestic GDP growth of around 5%; a consumer price increase of around 2%; and synchronization of resident income growth with economic growth. To this end, the government will implement a more proactive fiscal policy, adopt a moderately loose monetary policy, strengthen the people-oriented direction of macro policies, and comprehensively expand domestic demand. It can be anticipated that precise macro policies will promote the improvement and optimization of China's economy, and the stabilizing role of the domestic market will become even more prominent.
It is expected that by 2025, the domestic sales of textiles and apparel will continue to experience a stable but pressurized situation, while export pressures will significantly increase. Overall, the chemical fiber industry has the foundation to maintain stable operations, but still faces challenges such as intensified competition, greater operational pressures on enterprises, and increasing trade frictions. The entire industry needs to continue to unite and respond to these issues. The industry must fully stimulate internal motivation and effectively address cost and competitive pressures through self-discipline, technological innovation, product upgrades, and industrial transformation, while actively promoting stable and quality improvement in industry operations.
【Copyright and Disclaimer】The above information is collected and organized by PlastMatch. The copyright belongs to the original author. This article is reprinted for the purpose of providing more information, and it does not imply that PlastMatch endorses the views expressed in the article or guarantees its accuracy. If there are any errors in the source attribution or if your legitimate rights have been infringed, please contact us, and we will promptly correct or remove the content. If other media, websites, or individuals use the aforementioned content, they must clearly indicate the original source and origin of the work and assume legal responsibility on their own.
Most Popular
-

AI Computing Power Demand Ignites Electronic Fabrics! China Jushi Hits Limit Up! Domestic Substitution Welcomes Golden Window
-

Focus on going global! kingfa sci. leads, huitong, preter, and kumho nire follow, china’s modified plastics frenziedly expanding worldwide
-

Back-to-back major joker moves! covestro’s 1.32 million ton mdi dual-line expansion and hdi acquisition reshape global polyurethane landscape
-

Evonik Parts Ways With The Polyester Business! A Strategic Retreat By A Germany Chemical Giant And The Global Industry Shift
-

PA66 Cost and Profit: Broad-Based Weakness in the Feedstock Market Continues to Erode Cost Support for PA66 (202606)


