


The continuous increase in supply makes it inevitable for PE products to be export-oriented to meet external demand.
In recent years,PEThe continuous increase in product supply, coupled with the concentrated commissioning of large-scale refining and chemical enterprises, has led to a mismatch between the concentrated release of production capacity and the growth rate of demand in the industry. This has resulted in a scenario characterized by "dual growth in supply and demand, with pressure on profits," marking a transition from extensive expansion to refined development.
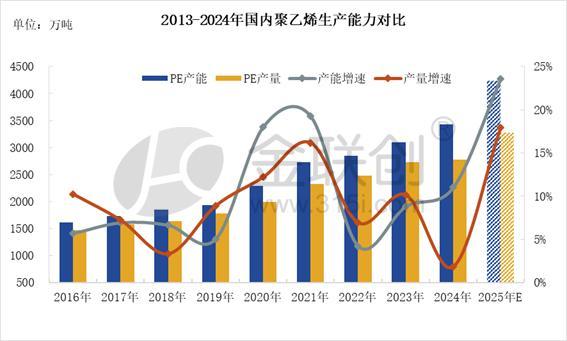
With the concentrated expansion of large domestic refining and chemical facilities, the capacity of polyethylene has significantly increased in various regions, leading to the full formation of a diversified competitive market landscape. After the new capacity was put into operation, most of it was used for producing general-purpose materials. With the expectation that the supply growth rate would significantly outpace the consumption growth rate, the favorable conditions for supply growth have weakened. As a result, the capacity utilization rate of polyethylene has decreased to varying degrees.
According to Jin Lianchuang statistics, as of2024Year,PEProduction capacity reaches343110,000 tons, with an annual growth rate of11%Since the production enterprises are all concentrated in the fourth quarter, the growth of output is not obvious, reaching2780.91 Ten thousand tons, with an annual growth rate of1.85%. Subsequent concentrated production of equipment is still expected.2025By 2023, China's polyethylene production capacity will reach423910,000 tons, with a significant synchronous increase in production, expected in3280The domestic polyethylene market is inevitably heading towards a fiercely competitive future with millions of tons at stake.
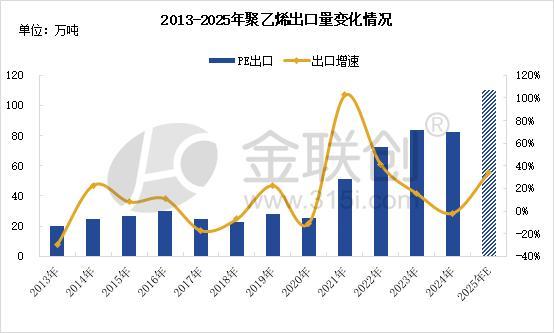
As domestic capacity continues to increase, the pressure on the supply side continues to rise. The products are primarily low-end, characterized by product homogeneity, price competition, similar sales models in the petrochemical and trading sectors, and similar usage directions, leading to a continuous compression of product profits. In the current situation of a surge in supply on the product side, China...PEThe pattern of imports and exports in the market has also changed significantly, with imports decreasing year by year, while exports have increased as domestic industries seek more export opportunities.
According to statistics from JLC,2024DomesticPEExport volume reached82.18ten thousand ton(s),2025Year DomesticPE Export volume is expected to reach11010,000 tons, expected to be2024annual increase27.82 Ten thousand tons, year-on-year increase33.85%。
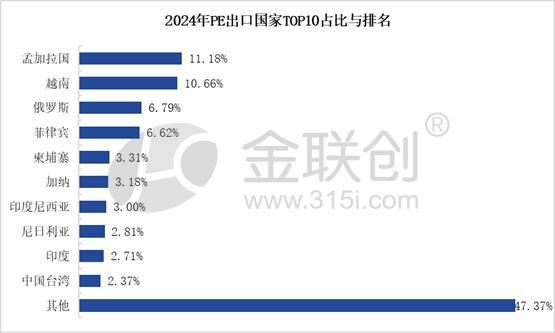
According to statistics from Jin Lian Chuan:2024YearPEExporting CountryTOP10From the perspective of proportion and ranking,PEThe target export enterprises mainly focus on Southeast Asia, South Asia, Russia, and parts of Africa. Currently, Southeast Asia and South Asia have absorbed some of the transfer of low-end manufacturing from China, with the overall manufacturing sector showing vigorous development. Proximity to China ensures low transportation costs and rapid, efficient delivery of goods, providing certain geographical advantages. Additionally, the well-established bilateral trade cooperation mechanisms and improved customs clearance convenience further enhance the appeal for domestic businesses.PEEnhance its export orientation.
As domestic competition pressure continues to intensify in the future, it is expected that polyethylene export volumes will continue to increase, expanding exports to Southeast Asia, Africa, and South America, thereby opening up overseas markets and fundamentally changing the import and export landscape. Additionally, the continued implementation of the Belt and Road Initiative and the ongoing opening of Sino-Russian trade ports will stimulate the northwest region.-Central Asia, Northeast-The possibility of demand growth in Russia's Far East region.
【Copyright and Disclaimer】The above information is collected and organized by PlastMatch. The copyright belongs to the original author. This article is reprinted for the purpose of providing more information, and it does not imply that PlastMatch endorses the views expressed in the article or guarantees its accuracy. If there are any errors in the source attribution or if your legitimate rights have been infringed, please contact us, and we will promptly correct or remove the content. If other media, websites, or individuals use the aforementioned content, they must clearly indicate the original source and origin of the work and assume legal responsibility on their own.
Most Popular
-

AI Computing Power Demand Ignites Electronic Fabrics! China Jushi Hits Limit Up! Domestic Substitution Welcomes Golden Window
-

Focus on going global! kingfa sci. leads, huitong, preter, and kumho nire follow, china’s modified plastics frenziedly expanding worldwide
-

Back-to-back major joker moves! covestro’s 1.32 million ton mdi dual-line expansion and hdi acquisition reshape global polyurethane landscape
-

Evonik Parts Ways With The Polyester Business! A Strategic Retreat By A Germany Chemical Giant And The Global Industry Shift
-

PA66 Cost and Profit: Broad-Based Weakness in the Feedstock Market Continues to Erode Cost Support for PA66 (202606)


