


The ABS industry has seen a significant increase in volume coupled with a decrease in costs, resulting in weak performance of ABS prices in the first quarter.
【Introduction】The production growth of the ABS industry was significant in the first quarter, coupled with the decline in prices of the three major raw materials, reducing the cost support for ABS. The oversupply situation became more pronounced, and the ABS prices maintained a downward trend from January to March, with an overall decrease of around 300-1000 yuan per ton. In the second quarter, new facilities will gradually start production, making it difficult to change the oversupply situation. It is expected that the ABS industry will remain weak overall.
Table 1: Comparison of ABS Price Trends in January and March
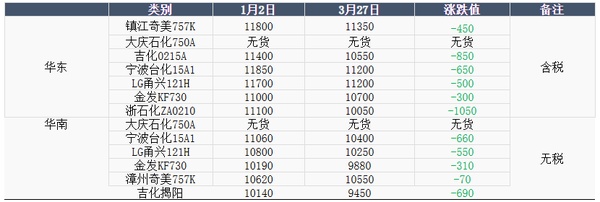
Source: LoncenInfo
In the first quarter of 2025, ABS prices experienced an initial rise followed by a decline, mainly divided into two phases. The first phase was a price-upward phase in January, while the second phase saw prices fluctuate downward from February to March. In January, the domestic ABS market maintained an upward trend. The Tianjin Dagu facility operated at reduced capacity, and some manufacturers pre-sold their inventory in January to avoid stockpiling during the Spring Festival, resulting in overall low inventory pressure for manufacturers. In mid-January, raw material prices surged, particularly for acrylonitrile and styrene, driving ABS prices to continue rising, with market prices generally on an upward trend. Starting in February and continuing into March, ABS prices declined. After the Spring Festival, terminal demand recovered slowly, and there were many negative factors in the market, leading to various degrees of price adjustments. Raw material costs for styrene, acrylonitrile, and butadiene decreased, increasing manufacturers' pressure to sell. As a result, prices adjusted downward, particularly in March, when the situation of oversupply became more pronounced due to lower costs and increased production, leading to a sustained downward trend in prices.
Figure 1: ABS Market Price Trend Chart for 2023-2025
![[ABS]:原料成本走弱叠加供应增量 ABS价格震荡走弱](https://oss.plastmatch.com/zx/image/2f5a7a4334304535a8c788d60fed9651.png "[ABS]:原料成本走弱叠加供应增量 ABS价格震荡走弱")
Source: Longzhong Information Group
The main factors influencing prices are as follows: 1. In the first quarter, the overall profitability of the ABS industry was positive, with production volumes increasing year-over-year and quarter-over-quarter. The total ABS production in the first quarter was 1.641 million tons, an increase of 394,500 tons compared to the same period last year, representing a growth rate of 31.9%; it also increased by 94,000 tons or 6.1% compared to the fourth quarter of 2024. 2. The prices of the three major raw materials for ABS generally declined, weakening the cost support for ABS and dragging down both factory and market prices. 3. Although large downstream demand is strong, small and medium-sized downstream orders are unstable, leading to a slower replenishment pace among downstream players. Additionally, the recovery in demand after the Spring Festival did not meet expectations, resulting in weak overall terminal demand.
1. In the first quarter, the ABS industry's output increased year-on-year and month-on-month, with a significant increase in supply.
In the first quarter, the ABS industry as a whole was profitable, with manufacturers' output increasing both year-on-year and quarter-on-quarter. The total ABS production in the first quarter was 1.641 million tons, an increase of 394,500 tons year-on-year, a growth of 31.9%, and an increase of 94,000 tons compared to the fourth quarter of 2024, a growth of 6.1%. The industry saw significant growth in the first quarter. Although some joint venture manufacturers had their goods pre-sold out from January to February, keeping inventory under control, the overall sales pressure in March was substantial. Particularly, after the holiday at the end of February, the recovery of terminal demand fell short of expectations, leading to noticeable inventory accumulation among manufacturers. Under supply pressure, prices were pushed downward.
Figure 2. Monthly ABS Production Chart for 2024-2025
![[ABS]:原料成本走弱叠加供应增量 ABS价格震荡走弱](https://oss.plastmatch.com/zx/image/6abf23f370c247549231fdd77f188567.png "[ABS]:原料成本走弱叠加供应增量 ABS价格震荡走弱")
Source: Longzhong Information
Second, the cost of raw materials has decreased, reducing the cost support for ABS, leading to price reductions:
The decline in costs is the main factor driving the downward trend in ABS prices. In the first quarter, the markets for key raw materials acrylonitrile, butadiene, and styrene all showed a pattern of rising first and then falling. From January to mid-February, temporary maintenance of acrylonitrile plants led to reduced supply, pushing prices up to a two-year high. From late February to March, prices gradually retreated from their highs due to increased production in East China and the return of maintenance units, dropping to a three-month low. In March, prices mostly stayed below 9,000 yuan/ton, a decline of over 3,000 yuan/ton from the early February peak of 12,000 yuan/ton. For styrene, low inventory in January, coupled with benzene destocking, led to a fluctuating upward trend in prices. From February to March, the decline in external crude oil prices, lower benzene prices, and increased main port inventory combined to drive styrene market prices down. The average styrene price in the first quarter was 8,414 yuan/ton, a decrease of 438 yuan/ton or 4.9% compared to the fourth quarter of 2024. For butadiene, prices fluctuated upward in January due to the rise in synthetic rubber futures. After February, increased supply put downward pressure on prices. In March, mixed positive and negative news kept prices low and fluctuating. As of March 31, the closing price in Jiangyin was 11,050 yuan/ton, a decrease of 1,450 yuan/ton or 11.6% from the early January high of 12,500 yuan/ton.
Figure 3: ABS Cost-Face Price Trend Chart
![[ABS]:原料成本走弱叠加供应增量 ABS价格震荡走弱](https://oss.plastmatch.com/zx/image/7321196ff62249898aa3cbba24c14396.png "[ABS]:原料成本走弱叠加供应增量 ABS价格震荡走弱")
Source:隆众资讯 Translated: Source: Longzhong Information
III. Sluggish Demand Growth: ABS Market Struggles to Shake Off Weakness:
In the first quarter, the domestic ABS market demand operated weakly, with market transactions gradually coming to a halt before the Spring Festival. Due to the advance in demand for home appliances driven by exports, some manufacturers had good pre-sale conditions, which overdraws the demand for 2025. After the Spring Festival, the recovery of demand was significantly below expectations, with poor replenishment conditions for downstream factories, slow recovery of factory operations, and insufficient raw material procurement efforts. Some home appliance companies indicated that there had not been a phase increase in orders, and overall, demand remained at a just-needed level.
The new production capacity will be gradually released in the second quarter, and the supply is expected to continue to increase. The cost side may continue to remain weak:
1、 In the second quarter, both facility maintenance and new facility commissioning are expected, and the supply volume is anticipated to remain high.
In the second quarter, there are maintenance plans for the Liaoning Jinfa and Tianjin Dagu facilities, but at the same time, the 600,000-ton new facility of Shandong Yulong Petrochemical and the second phase of Zhejiang Petrochemical's third line will be put into operation. The overall supply expectation for the second quarter continues to remain high, with an increase in monthly supply from Zhejiang Petrochemical from April to June.
2、 From a cost perspective:In the second quarter, the styrene market enters a low-demand season, and prices are expected to decline. For butadiene, the progress of new plant startups will influence price trends; if new capacity is successfully launched, prices are likely to fluctuate downward, while delays in startup could maintain a volatile trend. For acrylonitrile, a slight upward trend is anticipated in April-May, with a potential decline in June, with overall price fluctuations expected to range between 8,500-9,500 yuan/ton.
3、 From the perspective of demand:The traditional purchasing peak season for home appliances is in April and May, but the high demand for home appliances in 2024 has preemptively consumed the demand for 2025, resulting in overall demand in the first quarter falling short of expectations. Replenishment situations have been average, and June to July are traditionally the off-season for procurement. It is expected that the demand in the second quarter will increase only slightly.
Overall, the domestic ABS industry saw significant growth in the first quarter, with cost factors dragging market prices down in a volatile manner. In the second quarter, with high supply and limited demand growth, ABS prices are expected to trend weakly.
【Copyright and Disclaimer】The above information is collected and organized by PlastMatch. The copyright belongs to the original author. This article is reprinted for the purpose of providing more information, and it does not imply that PlastMatch endorses the views expressed in the article or guarantees its accuracy. If there are any errors in the source attribution or if your legitimate rights have been infringed, please contact us, and we will promptly correct or remove the content. If other media, websites, or individuals use the aforementioned content, they must clearly indicate the original source and origin of the work and assume legal responsibility on their own.
Most Popular
-

AI Computing Power Demand Ignites Electronic Fabrics! China Jushi Hits Limit Up! Domestic Substitution Welcomes Golden Window
-

Focus on going global! kingfa sci. leads, huitong, preter, and kumho nire follow, china’s modified plastics frenziedly expanding worldwide
-

Back-to-back major joker moves! covestro’s 1.32 million ton mdi dual-line expansion and hdi acquisition reshape global polyurethane landscape
-

Evonik Parts Ways With The Polyester Business! A Strategic Retreat By A Germany Chemical Giant And The Global Industry Shift
-

PA66 Cost and Profit: Broad-Based Weakness in the Feedstock Market Continues to Erode Cost Support for PA66 (202606)


