


September 2025 Top 30 SUV Sales and Complaints Review
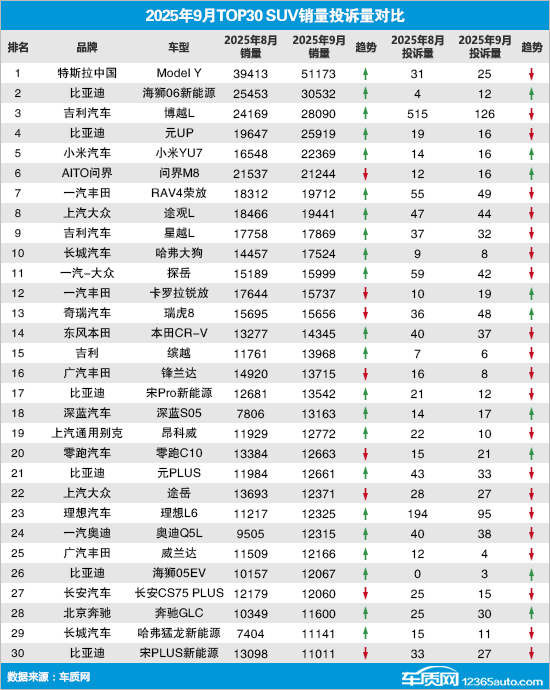
According to data from the China Automobile Dealers Association, the cumulative retail sales of the domestic SUV market reached 1.131 million units in September 2025, an increase of 11.8% month-on-month and 9.1% year-on-year. During the same period, Chezhiyuan received 7,157 valid complaints from SUV owners, a decrease of 5.8% month-on-month and an increase of 45.1% year-on-year. Excluding the information about voluntary withdrawals of complaints by the complainants, the complaint volume ranking for the top 30 SUV sales in September 2025 is as follows:
Japanese brand sales share struggles, while small SUV sales hit a new record.
In September, the domestic SUV market performed steadily at a high level, with sales exceeding one million vehicles for two consecutive months. Looking at the rankings, most models saw a month-on-month increase in sales, accounting for over 70%. Among them, the Deep Blue S05 stood out, achieving its highest monthly sales record since its launch, up 68.6% compared to August. Following closely is the Haval Menglong New Energy, which entered the rankings for the first time, with sales increasing by 50.5%. Additionally, the Xiaomi YU7 also saw significant growth this month, rising by 35.2% compared to the previous month. In contrast, the models that experienced a decline generally saw small decreases, with only the BYD Song PLUS New Energy and the FAW Toyota Corolla Ruifang showing double-digit declines, down 15.9% and 10.8% respectively month-on-month.
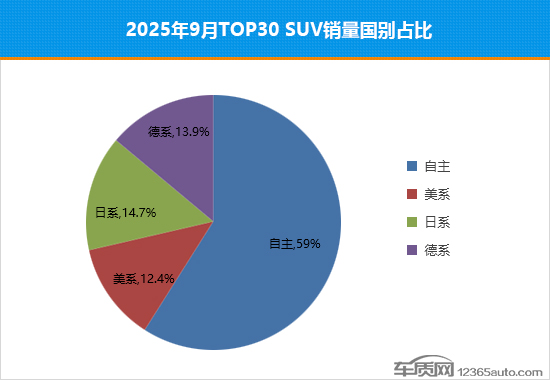

This month, the sales share of domestic, German, and American brands has all increased, with German brands leading the growth, rising by 1.6 percentage points compared to August. Meanwhile, Japanese brands performed poorly, not only with a decrease in the number of models on the list compared to the previous month but also a decline in overall sales, resulting in a drop in their sales share by 3.7 percentage points.
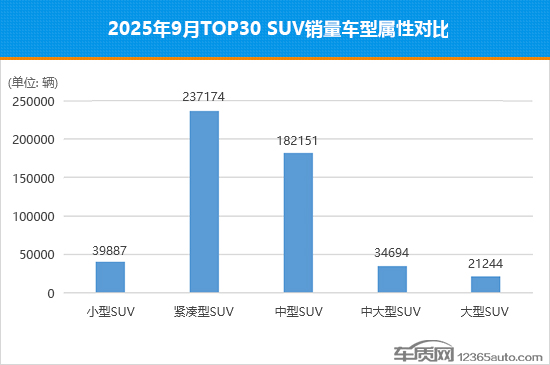
In September, the sales of small SUVs continued to soar, setting a new record for the highest monthly sales this year, with a month-on-month increase of about 27%, making it the vehicle segment with the highest sales growth this month. Additionally, the sales of compact SUVs, mid-size SUVs, and mid-large SUVs also saw a certain increase compared to the previous month. It is worth noting that the sales of large SUVs fell against the trend, decreasing by 33.8% compared to August, reaching the lowest point in nearly five months.
Quality issues return to dominance in complaints, with "transmission control module failure" complaints remaining high.
In stark contrast to the overall increase in sales, most of the models on the list experienced a month-on-month decrease in the number of complaints, with overall reputation performance better than in August. Leading the decline were Geely Boyue L and GAC Toyota Wildlander, with complaint volumes down by 75.5% and 66.7% respectively. Additionally, Buick Envision and Li Auto L6 also saw significant decreases in complaint volumes, with declines of over 50%, indicating an improvement in reputation. In comparison, there were 9 models that experienced a month-on-month increase in complaints this month, a notable decrease in number compared to last month. However, there were still instances of complaints more than doubling, such as with the BYD Seagull 06 New Energy.
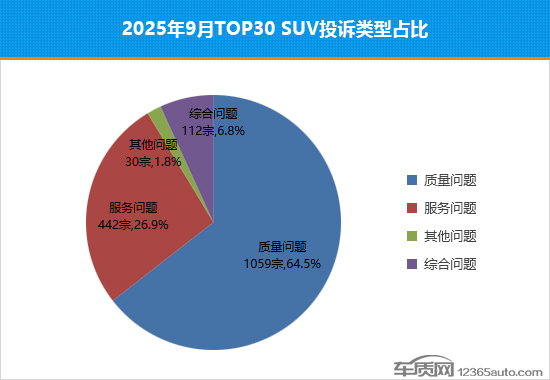
In September, the proportion of complaint types underwent a significant change, with quality issues returning to a dominant position, increasing by 26.3 percentage points compared to August, although the number of complaints saw a slight decrease month-on-month. In terms of complaint failure points, "transmission control module failure" still ranked first, with the number of complaints remaining high. Notably, complaints regarding "steering system noise" have eased, with a 54.5% month-on-month decrease in complaint numbers, dropping to fifth place.
The complaint-to-sales ratio of the 2021 model performs better than the same class.
According to the complaint-to-sales ratio statistics rules of CheZhiWang, the number of complaints for a vehicle model includes all valid complaints in the month (including information where the complainant voluntarily applies to withdraw the complaint due to satisfactory resolution). Statistics show that in September, the average complaint-to-sales ratio for SUVs was 3.68 per 10,000, a significant decrease compared to August, indicating a stable and improving trend overall.
Specifically regarding the rankings, there are 21 models with complaint-to-sales ratios lower than the average for SUVs in September. Among these, 15 models saw a month-on-month decline, with nearly half being domestic brands, showing some short-term improvement.
【Copyright and Disclaimer】The above information is collected and organized by PlastMatch. The copyright belongs to the original author. This article is reprinted for the purpose of providing more information, and it does not imply that PlastMatch endorses the views expressed in the article or guarantees its accuracy. If there are any errors in the source attribution or if your legitimate rights have been infringed, please contact us, and we will promptly correct or remove the content. If other media, websites, or individuals use the aforementioned content, they must clearly indicate the original source and origin of the work and assume legal responsibility on their own.
Most Popular
-

AI Computing Power Demand Ignites Electronic Fabrics! China Jushi Hits Limit Up! Domestic Substitution Welcomes Golden Window
-

Focus on going global! kingfa sci. leads, huitong, preter, and kumho nire follow, china’s modified plastics frenziedly expanding worldwide
-

PA66 Cost and Profit: Broad-Based Weakness in the Feedstock Market Continues to Erode Cost Support for PA66 (202606)
-

Back-to-back major joker moves! covestro’s 1.32 million ton mdi dual-line expansion and hdi acquisition reshape global polyurethane landscape
-

Evonik Parts Ways With The Polyester Business! A Strategic Retreat By A Germany Chemical Giant And The Global Industry Shift


