


Sanctions Lift Shockwave: Lifting the Ban on Russian Crude Oil Could Trigger a Global Oil Price Plunge of $15
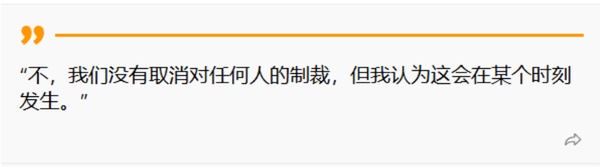
On February 26, US President Trump pointed out to reporters in the Oval Office when asked whether Washington would lift anti-Russian sanctions:
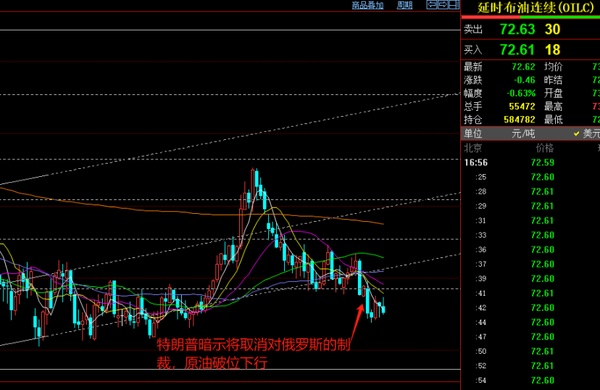
As a result, Brent crude broke through its support level, completely breaking the bottom of the range it had been operating in since the end of last year.
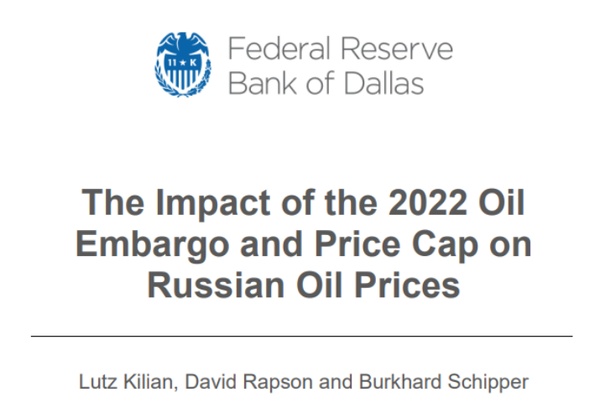
So, if the Western allies led by the United States fully lift the oil sanctions on Russia, what impact would this have on the international crude oil market? In March 2024, the Federal Reserve Bank of Dallas published a report - "The Impact of the 2022 Oil Embargo and Price Cap on Russian Oil Prices," which mentioned that the oil embargo forced Russia to accept a $32 per barrel discount in March 2023, with nearly half due to increased transportation costs, and the other half attributed to enhanced bargaining power from India and China. The impact of the price cap on Russian oil export prices was minimal, especially after allowing the use of Western shipping services.
Under the current comprehensive sanctions imposed by Western allies on Russian crude: Russia's crude exports still remain at a high level of about 5 million barrels per day, but are sold to the Asian market at a deep discount (Ural crude is priced $8-12 per barrel lower than Brent). Meanwhile, the global crude oil market is in a state of tight supply-demand balance, with Brent oil prices fluctuating around a central point of $80 per barrel, within a range of ±$5 per barrel.
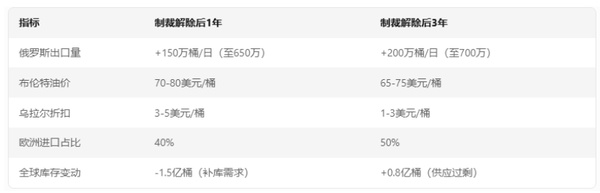
Once the EU, G7, and other Western allies fully lift the oil embargo and price cap policies on Russia, restoring free access for Russian crude to the international market, the international crude oil market will first be hit by a supply-side shock: Russia could quickly resume crude exports to Europe (before the sanctions, Europe imported about 2.5 million barrels per day), and combined with existing exports from the Middle East, the daily global crude supply could increase by 1-1.5 million barrels.
If OPEC+ does not take measures to cut production, international oil prices could fall by $10-15 per barrel. For example, the central price of Brent crude might drop to $70, with a fluctuation range of ±$5 per barrel.
The regional markets would then undergo a rebalancing process: during this phase, European demand would first shift, as European refineries would repurchase Russian Ural crude, reducing their dependence on the Middle East (such as Saudi Arabia and Iraq) and U.S. shale oil.
At the same time, Asian oil prices would face a narrowing discount: the bargaining power of buyers like India and China would weaken, and the discount on Russian crude could narrow from $8-12 to $3-5, with ESPO crude prices approaching international levels.
In addition, energy logistics and costs would also be restructured: once European ports reopen to Russia and routes are restored, the average transport distance for Russian crude would be significantly shortened, such as from the Baltic Sea to Europe taking only 3-5 days, compared to 20 days to India; transport costs would decrease by about $5-8 per barrel, greatly improving efficiency.
Moreover, the "shadow tanker fleet" that relies 70% on non-Western insurance might return to the regular market, increasing nominal capacity and lowering the cost of trade friction.
If Russia can maintain an export volume above 5 million barrels per day, it may again become the largest crude supplier to Europe (accounting for over 30%), while squeezing out North Sea and West African crude.
The greatest impact might be an intensification of internal competition within OPEC+—to protect market share, Saudi Arabia might be forced to further cut production to stabilize oil prices or adopt more aggressive measures—restarting a price war with Russia. Regardless of the approach, the cooperation agreement between Russia and OPEC would face pressure for renegotiation.
In summary, the return of Russian crude to the mainstream market would help stabilize the global crude supply chain, reduce geopolitical risk premiums, and lower the volatility of international oil prices from the current 20% to the historical average of 12-15%.
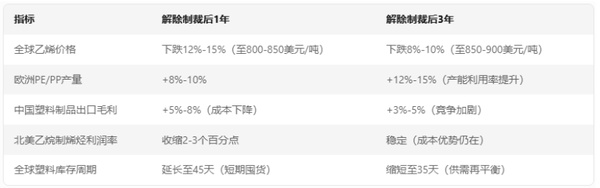
For the plastics industry, if Russian crude returns to the international market, Brent crude prices might fall by $10-15 per barrel (in the short term), and naphtha prices would decline in tandem (by about $80-120 per ton). Using PE (polyethylene) as an example to calculate costs (assuming crude accounts for 50% of costs, and a 15% drop in oil prices): PE production costs could decrease by 7.5%, expanding corporate profit margins.
For intercontinental trade:
Europe: With the resumption of direct Russian oil supplies, the landed price of naphtha could decrease by 10%-15%, stimulating the restart of old cracking units in Europe (such as BASF and INEOS plants). Ethylene capacity utilization could rise from 70% to over 85%, increasing PE/PP supply and creating a more relaxed supply-demand situation in the region.
Asia: As the discount on Russian oil narrows (from $8-12 to $3-5), the cost of naphtha in Asia might slightly increase, but the overall decrease in global oil prices would still bring net benefits. However, large private refining projects in China (such as Hengli Petrochemical and Rongsheng Petrochemical), which rely on cheap Russian oil, would see their cost advantage diminish, narrowing the price gap with imports from the Middle East (Saudi Aramco) and North America (Dow Chemical).
North America: Ethane prices, which are decoupled from crude, would see a relatively weakened low-cost advantage, though the impact would be limited. The competitiveness of North American ethane derivatives (such as LLDPE) in the European export market would decrease.
Changes in trade flows: Europe would reduce imports of ethylene monomers from the Middle East, and Asian exporters (such as Lotte Chemical) might turn to Southeast Asian markets.
In terms of prices, the transmission of falling crude prices to the end prices of plastic products generally lags by 3-6 months. Therefore, intermediaries (traders, processors) might stockpile low-cost raw materials in the short term, leading to longer inventory cycles. If the market expects further declines in oil prices, midstream dealers might delay purchases, causing "inventory reduction" pressure and exacerbating short-term price volatility.
The decrease in raw material costs would significantly benefit integrated leaders (such as SABIC and Sinopec), while smaller companies relying on spot purchases might face pressure due to increased price volatility.
In summary, after lifting sanctions on Russian energy, the market would benefit from lower raw material costs in the short term, improving the profitability of plastics companies. However, in the long term, the recovery of European capacity would lead to increased competition with Asian petrochemical products, and the industry should be wary of the risk of structural oversupply.
Author: Gao Xing, Senior Market Analysis Expert at Plastics Vision

【Copyright and Disclaimer】This article is the property of PlastMatch. For business cooperation, media interviews, article reprints, or suggestions, please call the PlastMatch customer service hotline at +86-18030158354 or via email at service@zhuansushijie.com. The information and data provided by PlastMatch are for reference only and do not constitute direct advice for client decision-making. Any decisions made by clients based on such information and data, and all resulting direct or indirect losses and legal consequences, shall be borne by the clients themselves and are unrelated to PlastMatch. Unauthorized reprinting is strictly prohibited.
Most Popular
-

AI Computing Power Demand Ignites Electronic Fabrics! China Jushi Hits Limit Up! Domestic Substitution Welcomes Golden Window
-

Focus on going global! kingfa sci. leads, huitong, preter, and kumho nire follow, china’s modified plastics frenziedly expanding worldwide
-

Back-to-back major joker moves! covestro’s 1.32 million ton mdi dual-line expansion and hdi acquisition reshape global polyurethane landscape
-

Evonik Parts Ways With The Polyester Business! A Strategic Retreat By A Germany Chemical Giant And The Global Industry Shift
-

PA66 Cost and Profit: Broad-Based Weakness in the Feedstock Market Continues to Erode Cost Support for PA66 (202606)


