


Plastic Products Exports to United States Continue to Decline, Polyolefins Restricted by Domestic Demand
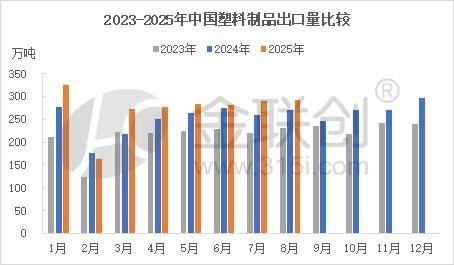
In August 2025, the export volume of plastic products increased by 8.5% year-on-year and by 1.17% month-on-month, while the export value rose by 0.61% year-on-year but decreased by 1.46% month-on-month. From January to August, the cumulative export volume of plastic products increased by 9.79% year-on-year, while the cumulative export value decreased by 1.02%. In 2024, the total export volume reached 30.7268 million tons, representing a year-on-year increase of 17.63%. In August, both the export volume and value of plastic products saw year-on-year increases, while the volume and value of exports to the United States continued to decline. The increase in plastic exports in August reflects that the U.S. tariffs have little impact on China, as China expands its market in ASEAN and other non-U.S. regions. The cumulative growth rate of plastic product exports from January to August remains lower than the average growth rate for the entire year of 2024.
In August, polyolefins continued to exhibit a weak fundamental situation, with polyolefin prices declining. It is expected that in September, under the weak fundamentals, prices will continue to explore lower levels. It is anticipated that in October, the impact of policy measures will be limited, and the fundamentals, especially domestic demand, will be the main influencing factors, with prices expected to remain fluctuating at the bottom.
The export volume and value of plastic products have increased year-on-year.

Data source: General Administration of Customs, Jinlianchuan
In August 2025, the export volume of plastic products was 2.9272 million tons, an increase of 8.5% year-on-year and 1.17% month-on-month. The export value was 8.503 billion US dollars, up 0.61% year-on-year but down 1.46% month-on-month. From January to August, the cumulative export volume of plastic products was 21.8487 million tons, an increase of 9.79% year-on-year, while the cumulative export value was 68.913 billion US dollars, a decrease of 1.02% year-on-year. In 2024, the annual export volume was 30.7268 million tons, an increase of 17.63% year-on-year. Overall, in August, both the export volume and value of plastic products showed a year-on-year increase. The increase in plastic product exports in August indicates that the impact of US tariffs on China is minimal, as China is expanding into non-US markets such as ASEAN. The cumulative growth rate of plastic product exports from January to August remains lower than the average growth rate for the entire year of 2024.
The average export price of plastic products is lower than last year.
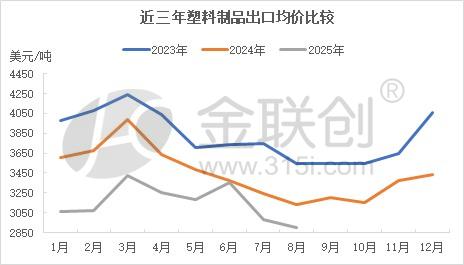
Data source: General Administration of Customs, JLC Network Technology
As of August 2025, the average export price of plastic products is lower than that of the same period in 2024. Moreover, the price trends over the past three years have been largely consistent, with prices rising from January to March, followed by a continuous decline from March to August.
Overall, the export volume of plastic products has increased year-on-year, while prices have significantly declined. Currently, the growth rate of plastic product exports remains high, but the increase in export value is decreasing, reflecting a weak export price situation. Exports to Europe and the United States still face uncertainties due to the trade war, while exports to ASEAN have shown significant growth, maintaining a generally positive trend in exports.
The volume of plastic products exported from China to the United States has significantly decreased.
Data source: National Bureau of Statistics, Jinlianchuan
In August 2025, China's exports of plastic products to the United States amounted to 409,400 tons, a year-on-year decrease of 120,500 tons, representing a reduction of 22.74%. Compared to June, it decreased by 58,300 tons, with a decline of 12.5%. As shown in the chart, the export quantity of plastic products to the U.S. in July decreased compared to June, and continued to decrease in August compared to July. Due to Trump's tariff policy, the tariff truce period between the U.S. and China will be extended for another 90 days, until November 10, 2025. In the first eight months of the year, China has taken precautions and continued to vigorously explore non-U.S. markets, with good export performance to ASEAN and Belt and Road countries, which can compensate for the decrease in exports to the U.S. Therefore, overall, China's exports of plastic products remain stable. In September, the polyolefin market will continue to be weak due to weak fundamentals, and prices are expected to continue to test lower levels. Specifically, the PP2601 futures are in the range of 6,800-7,200 yuan/ton, while the L2601 futures are between 7,000-7,400 yuan/ton. It is anticipated that the policy stimulus will be limited in October, and the internal demand will be a major influencing factor, with expectations of continued bottom oscillation.
【Copyright and Disclaimer】The above information is collected and organized by PlastMatch. The copyright belongs to the original author. This article is reprinted for the purpose of providing more information, and it does not imply that PlastMatch endorses the views expressed in the article or guarantees its accuracy. If there are any errors in the source attribution or if your legitimate rights have been infringed, please contact us, and we will promptly correct or remove the content. If other media, websites, or individuals use the aforementioned content, they must clearly indicate the original source and origin of the work and assume legal responsibility on their own.
Most Popular
-

AI Computing Power Demand Ignites Electronic Fabrics! China Jushi Hits Limit Up! Domestic Substitution Welcomes Golden Window
-

Focus on going global! kingfa sci. leads, huitong, preter, and kumho nire follow, china’s modified plastics frenziedly expanding worldwide
-

Back-to-back major joker moves! covestro’s 1.32 million ton mdi dual-line expansion and hdi acquisition reshape global polyurethane landscape
-

Evonik Parts Ways With The Polyester Business! A Strategic Retreat By A Germany Chemical Giant And The Global Industry Shift
-

PA66 Cost and Profit: Broad-Based Weakness in the Feedstock Market Continues to Erode Cost Support for PA66 (202606)


