


【PET Weekly Review】Polyester Bottle Chip Market Weak Rebound
This weekMarket Focus:
Production: Capacity utilization rate is 75.02%.
Raw material: PTA industry operating rate is 80.48%.
2. Market Analysis
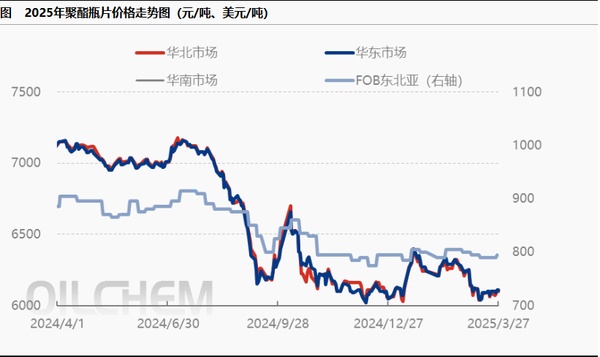
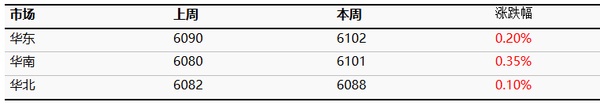
Table: Comparison of Domestic Polyester Bottle Flake Market Price Changes (Unit: Yuan/Ton)
Data source: Longzhong Information
In this period (March 21-27, 2025), the polyester bottle chip market experienced a weak rebound. The weekly average price of water bottle grade in East China was 6,102 yuan/ton, an increase of 12 yuan/ton compared to last week, with a rise of 0.20%. Geopolitical factors influenced the market, as low crude oil prices rebounded, pushing up the prices of polyester bottle chips. However, as the end of the month approached, some holders faced increased pressure to sell, leading to low-priced sales that hindered the upward momentum of the market. Additionally, demand from the end-users was lackluster, with only minimal purchasing driven by necessity, resulting in sluggish trading activity. By the close, the spot price of polyester bottle chips water grade in East China reached 6,110 yuan/ton, an increase of 40 yuan/ton compared to the same period last week, with a rise of 1.15%.
3. Market Influencing Factors Analysis
During this trading period (March 21-27, 2025), the domestic polyester bottle chip production was 307,500 tons, an increase of 16,500 tons compared to last week, representing a growth of 5.67%.
During this trading cycle (March 21, 2025 - March 27, 2025), based on the production cost calculation model from Longzhong Information, the average aggregate cost is 5699.48 yuan/ton, an increase of 65.47 yuan/ton or +1.16% compared to last week. The average profit in the polyester bottle chip industry is -197.48 yuan/ton, a decrease of 53.48 yuan/ton or -37.14% compared to last week.
4. Forecasting:
Supply Forecast: A certain factory in East China plans to restart its 500,000-ton production line by the end of the month, while a factory in Northeast China plans to restart its 700,000-ton production. Next week, the production of polyester bottle flakes is expected to increase to 323,700 tons.
Demand Forecast: The beverage industry is expected to operate at around 75%, the oil industry is expected to operate at around 43%, and the PET sheet industry is stable. Domestic terminal demand is performing generally, mainly focused on inventory digestion.
Next week's forecast: The downstream will mainly focus on digesting previous inventories, with little change in delivery. Next week, all maintenance units are expected to restart, so the short-term supply pressure is manageable. As supply increases, it is anticipated that industry processing fees will continue to be compressed. The polyester bottle chip market is expected to maintain a low-level oscillation next week, with spot prices for water bottle materials in East China expected to be between 6050-6130 yuan/ton.
【Copyright and Disclaimer】The above information is collected and organized by PlastMatch. The copyright belongs to the original author. This article is reprinted for the purpose of providing more information, and it does not imply that PlastMatch endorses the views expressed in the article or guarantees its accuracy. If there are any errors in the source attribution or if your legitimate rights have been infringed, please contact us, and we will promptly correct or remove the content. If other media, websites, or individuals use the aforementioned content, they must clearly indicate the original source and origin of the work and assume legal responsibility on their own.
Most Popular
-

AI Computing Power Demand Ignites Electronic Fabrics! China Jushi Hits Limit Up! Domestic Substitution Welcomes Golden Window
-

Focus on going global! kingfa sci. leads, huitong, preter, and kumho nire follow, china’s modified plastics frenziedly expanding worldwide
-

PA66 Cost and Profit: Broad-Based Weakness in the Feedstock Market Continues to Erode Cost Support for PA66 (202606)
-

Back-to-back major joker moves! covestro’s 1.32 million ton mdi dual-line expansion and hdi acquisition reshape global polyurethane landscape
-

Evonik Parts Ways With The Polyester Business! A Strategic Retreat By A Germany Chemical Giant And The Global Industry Shift


