


[pet daily review] polyester bottle flake market slightly declines
1 Today's Summary
①. Yisheng's basis remains stable, while other factories have decreased by 20-70. Unit: Yuan/Ton
Today, the domestic polyester bottle chip capacity utilization rate is at 73.37%.
2 Spot Overview
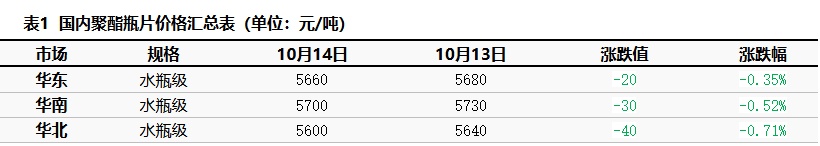
Based on the East China region, today's spot price for polyester bottle-grade PET closed at 5660, down 20 from the previous working day, in line with the morning forecast.
The market sentiment is pessimistic, with raw material prices continuing to decline. Coupled with no favorable factors supporting the supply and demand of polyester bottle chips, factory quotes have been reduced by 20-70 yuan. The market focus is shifting downward, with some traders replenishing stocks, and just-in-time demand purchasing at low prices. It is heard that October sources were transacted at 5880-5760, with most transactions at lower prices, and slightly higher transactions at 5820 in some areas. November sources were transacted at 5580-5770, while December sources were transacted at 5560-5710. Futures contract 2511 shows a premium of 10-100, with the basis remaining stable. A major terminal factory is holding a tender. (Unit: yuan/ton)
|
Figure 1: 2025 Domestic Polyester Bottle Chip Price Trend Chart (Yuan/Ton) |
Figure 2: Domestic Polyester Bottle Chip Market Price Trend Chart for 2025 (Yuan/Ton) |
|
|
|
|
Data Source: Longzhong Information |
Data Source: Longzhong Information |
")
")
3. Production Dynamics
Today, the capacity utilization rate of polyester bottle chips reached 73.37%. In terms of profit, the raw material PTA price dropped by 55 to 4385, MEG price rose to 4150, polymerization cost decreased by 56.52 to 5156.97, and polyester bottle chip profit incurred a loss of 96.97 yuan/ton.
|
Figure 3: Trend of Domestic Polyester Bottle Chip Capacity Utilization Rate in 2024-2025 |
Figure 4: Comparison of Domestic Polyester Bottle Chip Profits and Prices in 2025 (Yuan/Ton) |
|
|
|
|
Data Source: Longzhong Information |
Data Source: Longzhong Information |
")
")
4. Market Sentiment
Table 2: Sentiment Expectations of Domestic PET Bottle Chip Industry Participants (Updated on Mondays)
|
Perspective |
Quantity |
Proportion |
Month-on-month |
|
Bullish |
7 |
28% |
8% |
|
Bearish |
13 |
52% |
-8% |
|
Flat |
5 |
20% |
0% |
5. Price Prediction
External negative news has emerged, leading to a strong pessimistic sentiment in the commodity market, and the polyester bottle chip market may continue to adjust weakly. Supply remains stable, and it is expected that tomorrow the spot price of polyester bottle chips for water bottles in East China will operate in the range of 5550-5700 yuan/ton.
6. Related Product Information
PTA Market: The focus of East China PTA prices declines. , Negotiation reference around 4385. 10 The main port delivery for January is trading at a discount of 75-85. The November main port delivery for January is quoted at a discount of 45-60, with offers at a discount of 55-65 for transactions and negotiations. The overall sentiment in the commodity market is sluggish, with weak industrial expectations weighing down, and the spot prices and spot basis continue to weaken, resulting in a generally moderate trading atmosphere. (Unit: yuan/ton)
MEG Market : Morning Ethylene Glycol MarketPrices have fallen again, driven by renewed concerns about a pessimistic supply-demand outlook, leading to market weakness. At the opening of the morning session, spot prices in Zhangjiagang opened low at around 4150. Buying interest was cautious during the session, and the focus of negotiations shifted downward. By midday close, spot prices were being negotiated in the 4120-4125 range, with a slight weakening in the spot basis. Morning negotiations ranged from 01+66 to 01+68. The South China market followed the decline, with offers for petroleum grade delivery around 4280, mainly for essential purchasing by buyers. In the dollar-denominated market, negotiations in the morning ranged from 482-485 with no reported transactions.
7. Data Calendar
Table 3 Overview of Domestic Polyester Bottle Chip Data (Unit: 10,000 tons, %)
|
Data |
Publication Date |
Previous data |
Current Trend Forecast |
|
Capacity utilization rate |
Weekday 17:00 |
73.37% |
→ |
|
Weekly Production |
Thursday 5:00 PM |
33.15 |
→ |
|
Weekly Capacity Utilization Rate |
Thursday 5:00 PM |
72.59% |
→ |
|
Data Source: Longzhong Information Remarks: 1 The upward and downward movements are considered significant fluctuations, highlighting the data dimensions with a change exceeding 3%. 2 Considered as narrow fluctuations, highlight data with fluctuation range within 0-3%. |
|||
【Copyright and Disclaimer】The above information is collected and organized by PlastMatch. The copyright belongs to the original author. This article is reprinted for the purpose of providing more information, and it does not imply that PlastMatch endorses the views expressed in the article or guarantees its accuracy. If there are any errors in the source attribution or if your legitimate rights have been infringed, please contact us, and we will promptly correct or remove the content. If other media, websites, or individuals use the aforementioned content, they must clearly indicate the original source and origin of the work and assume legal responsibility on their own.
Most Popular
-

AI Computing Power Demand Ignites Electronic Fabrics! China Jushi Hits Limit Up! Domestic Substitution Welcomes Golden Window
-

Focus on going global! kingfa sci. leads, huitong, preter, and kumho nire follow, china’s modified plastics frenziedly expanding worldwide
-

Back-to-back major joker moves! covestro’s 1.32 million ton mdi dual-line expansion and hdi acquisition reshape global polyurethane landscape
-

Evonik Parts Ways With The Polyester Business! A Strategic Retreat By A Germany Chemical Giant And The Global Industry Shift
-

PA66 Cost and Profit: Broad-Based Weakness in the Feedstock Market Continues to Erode Cost Support for PA66 (202606)


