


[pet daily review] polyester bottle chip market continues to show weak trend
1 Today's Summary
①. Factory prices mostly drop by 10-30, some remain stable. (Unit: Yuan/Ton)
②. Today's domestic polyester bottle chip capacity utilization rate is 71.53%.
2 Spot Overview
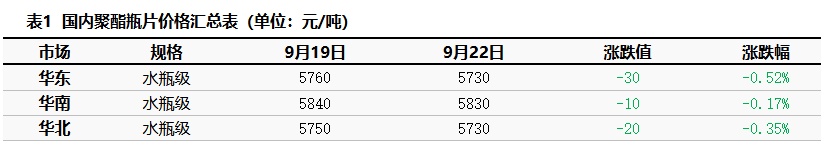
In the East China region, the spot price of polyester bottle-grade chips closed at 5730 today, down 30 from the previous working day, in line with the morning forecast.
The cost continues to show a weak trend, with polyester bottle chip factory quotations mostly stable or decreased by 10-30. The market focus moves downward accordingly. The offers for September to November supply are between 5700-5950, and the September to November contract offers are at a 2511 premium of 0-20, with higher premiums of 60-70. Inquiries are at 5700-5880, and the September to November contract bids are at a 2511 discount of 0-70, with higher premiums of 30-80. Unit: Yuan/ton.
|
Figure 1: Domestic Polyester Bottle Chip Price Trend Chart for 2025 (Yuan/Ton) |
Figure 2: 2025 Domestic Polyester Bottle Chip Market Price Trend Chart (Yuan/Ton) |
|
|
|
|
Data Source: Longzhong Information |
Data source: Longzhong Information |
")
")
3. Production Update
Today, the capacity utilization rate of polyester bottle chips has reached 71.53%. In terms of profit, the raw material PTA price decreased by 40 to 4515, MEG price decreased by 10 to 4342, polymerization cost decreased by 38 to 5315, and polyester bottle chip profit loss is 202.96 yuan/ton.
|
Figure 3: Trend of Domestic Polyester Bottle Chip Capacity Utilization Rate in 2024-2025 |
Figure 4: Comparison of Domestic Polyester Bottle Chip Profit and Price in 2025 (Yuan/Ton) |
|
|
|
|
Source of data: Longzhong Information |
Data Source: Longzhong Information |
")
")
4. Market Sentiment
Table 2 Domestic Polyester Bottle Chip Industry Participants' Sentiment Expectations (Updated on Mondays)
|
Viewpoint |
Quantity |
Percentage |
Month-on-month |
|
Bullish |
6 |
28% |
0% |
|
Bearish |
14 |
33% |
0% |
|
Flat |
5 |
39% |
0% |
5. Price Forecast
Supply remains stable at a low level, with the demand side making rigid replenishments at low points. In the short term, the market is considering...Factories are focusing on inventory reduction, with bottom prices offering support, yet commodities remain sluggish, weighed down by costs. Expectations for tomorrow are... Polyester bottle chips may continue to fluctuate weakly, with the spot price of polyester bottle-grade chips in East China expected to range between 5,680-5,850 yuan/ton.
6. Related Product Information
PTA Market: Today's PTA Spot Price -40 To 4515 。 9 January main port delivery offers at a discount of 75-80, bids at a discount of 80-85, with negotiations for transactions. October main port delivery offers at a discount of 50-65, bids around a discount of 65 with transactions. The overall sentiment for commodities is sluggish, with expectations of both supply and demand decreasing. The absolute price within the day follows the cost downwards, and the spot basis remains weak, with overall transactions being light. (Unit: Yuan/ton)
MEG market : Today, the ethylene glycol market continued its downward trend. At the opening of the morning session, the spot price in Zhangjiagang opened around 4360. Due to factors such as inventory increase, the focus of negotiations shifted downward during the session. In the afternoon, prices remained weak, and by the close, spot prices were being negotiated around 4335. The spot basis strengthened, running within 01+90 to 01+96 during the day. The South China market was lackluster, with downstream demand weak and transactions stagnant.
7. Data Calendar
Table 3 Overview of Domestic Polyester Bottle Chip Data (Unit: 10,000 tons, %)
|
Data |
Publication Date |
Previous Data |
Current trend forecast |
|
Capacity utilization rate |
Weekday 17:00 |
71.53% |
→ |
|
Weekly Production Volume |
Thursday 5:00 PM |
33.03 |
→ |
|
Weekly Capacity Utilization Rate |
Thursday 5:00 PM |
72.31% |
→ |
|
Data Source: Longzhong Information Remarks: 1 The symbols "↓↑" are considered significant fluctuations, highlighting data dimensions with changes exceeding 3%. 2 Considered as narrow fluctuations, highlighting data with a rise or fall within 0-3%. |
|||
【Copyright and Disclaimer】The above information is collected and organized by PlastMatch. The copyright belongs to the original author. This article is reprinted for the purpose of providing more information, and it does not imply that PlastMatch endorses the views expressed in the article or guarantees its accuracy. If there are any errors in the source attribution or if your legitimate rights have been infringed, please contact us, and we will promptly correct or remove the content. If other media, websites, or individuals use the aforementioned content, they must clearly indicate the original source and origin of the work and assume legal responsibility on their own.
Most Popular
-

AI Computing Power Demand Ignites Electronic Fabrics! China Jushi Hits Limit Up! Domestic Substitution Welcomes Golden Window
-

Focus on going global! kingfa sci. leads, huitong, preter, and kumho nire follow, china’s modified plastics frenziedly expanding worldwide
-

Back-to-back major joker moves! covestro’s 1.32 million ton mdi dual-line expansion and hdi acquisition reshape global polyurethane landscape
-

Evonik Parts Ways With The Polyester Business! A Strategic Retreat By A Germany Chemical Giant And The Global Industry Shift
-

PA66 Cost and Profit: Broad-Based Weakness in the Feedstock Market Continues to Erode Cost Support for PA66 (202606)


